The #1 mistake you can make when optimizing and scaling your Facebook ads is looking at cost per click (CPC). In fact, I recommend taking CPC, cost per 1000 impressions (CPM) and Facebook’s “Relevance Score” off your metrics dashboard.
To put it frankly: if you’re making ad-buying decisions based on these metrics, your decision-making process is no better than arbitrarily turning ads on and off.

“I’ve spent a couple million dollars on PupSocks ads. If I killed ads that were above average in CPCs, my return on ad spend (ROAS) would have dropped by at least 40%.”
– Vincent Wu, Digital Marketing Analyst
Common Thread Collective
Are you ready to start making ad-buying decisions based on purchase-intent metrics instead of vanity metrics?
Watch this video to see the most important metric you need to focus on:
Then follow this data-driven case study on how to measure the performance of your Facebook ads based on purchases (not click costs).
%(tableofcontents)
Key #1: Understand How The Facebook Ad Auction Works
For every ad you publish across Facebook’s family of apps (Facebook, Messenger, WhatsApp, and Instagram), Facebook holds an automated auction among advertisers bidding for the same ad space. This auction determines whose ad gets shown to your target audience.
The goal of Facebook’s ad auction is to balance two key objectives:[*]
-
Creating value for advertisers by helping them reach and get results from people in their target audiences.
-
Providing positive, relevant experiences for people using the Facebook platform.
What sets Facebook advertising apart from other digital marketing platforms is the concept of "people-based" ad pricing. People based ad pricing matches the right ad to the right person at the right time. The more relevant the ad is to the target audience, the less it will cost the advertiser for that ad space.
Facebook is unlike traditional ad auctions, such as television or print, where the ad spot goes to the highest monetary bidder. Facebook shows ads that generate the highest total value for advertisers and users. This is a combination of:
-
Advertiser bid.
-
Facebook’s estimated action rate for your ad.
-
Ranking of the ad quality and the user value it generates.[*]
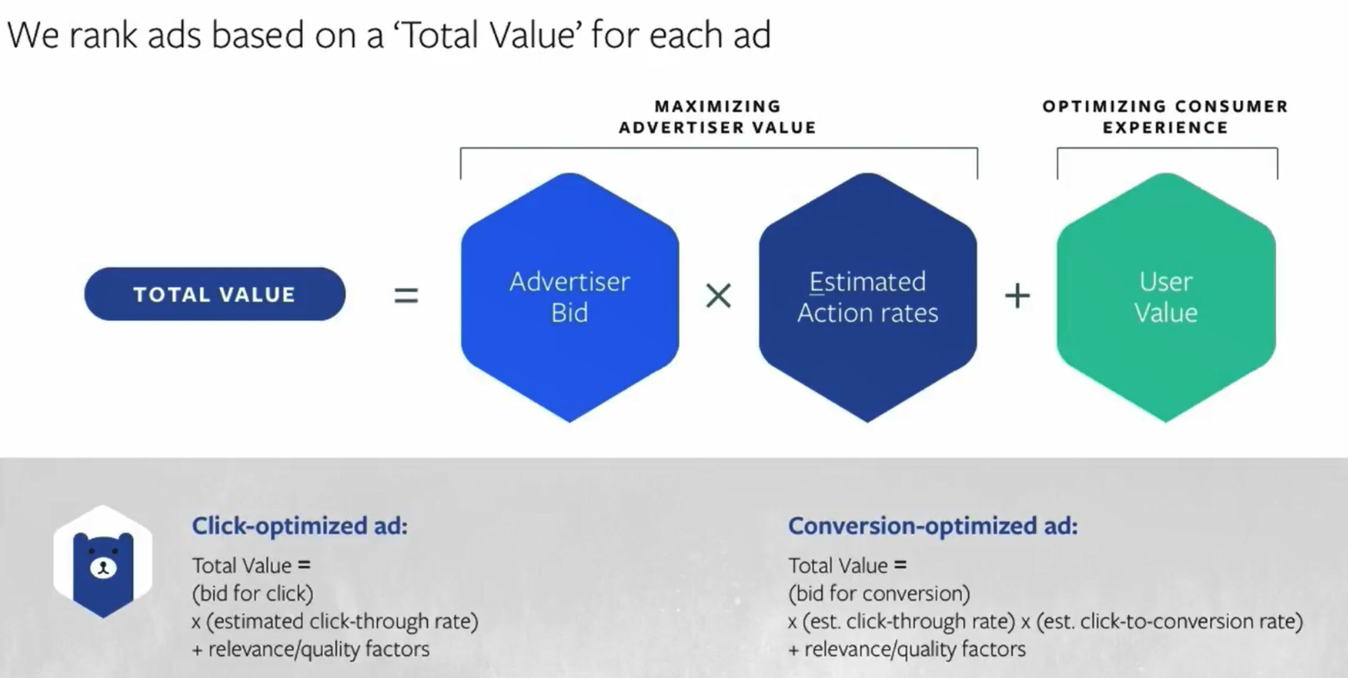
We'll dive into the meanings of these factors in more detail below.
So why doesn’t Facebook just reserve ad spots for advertisers who are willing to pay the most? It’s because the survival of the Facebook platform relies on maintaining a high-quality feed experience for the people who use it every day that is both satisfying and engaging.
It’s in Facebook’s best interest to show the most relevant ads to every user. If Facebook gave advertising space to the highest bidder, bad content would permeate throughout Facebook, causing users to reduce their time spent scrolling through their feed.
The effectiveness of Facebook ads relies on having a large pool of highly engaged shoppers always-on platform. Take away those shoppers with a bad feed experience, and Facebook has no advertisers willing to spend money on their ads.
Keeping Facebook’s goal of positive user experience in mind, the platform also aims to assist advertisers by connecting ads to the people Facebook believes will most likely complete your optimization event (e.g., purchase).
The phrase “estimated action rates” is Facebook’s determination of how likely a person is to act on your ad based on your historical ad performance, post-click experience, and the previous actions of the person you are attempting to advertise to. In extreme examples, having a poor post-click experience can lead to your ads being banned from delivery all together.

Key #2: Get High-Converting Traffic That Costs More
Just like individual ads are ranked by Facebook for their ‘total value’, each person on Facebook is assigned a designated value based on the demand for their ad space.[*]
Putting your ad in front of valuable people is certainly going to cost more because of the increased demand for high-converting shopper’s ad space. I like to think about this scenario in terms of two user profiles to demonstrate what type of shoppers may end up in your ad targeting: Sally Shopper and Skeptic Scott!
Exhibit A: Sally Shopper’s Terrific Traffic
Meet Sally Shopper![*]

Sally Shopper is a 25-year-old American woman who is a frequent online shopper and is highly persuaded by the ads she sees on Facebook. In fact, Sally clicks the majority the advertisements she sees and frequently purchases the products she discovers on Facebook and Instagram.
Thousands of advertisers want to show ads to people like Sally as she scrolls through her Facebook feed. Facebook determines, through the auction, how interesting and relevant they think Sally will find each of these advertisers’ ads and her likelihood of purchasing after seeing an ad.[*]

Facebook’s goal is to show the right ad to the right person at the right time, and the algorithm is optimized to show individual users ads Facebook believes will be the most engaging to that user.
However, because Facebook also aims to limit the number of ads people see in their feed to uphold a great user experience, advertisers must compete against other advertisers for a limited number of ad spaces. This is especially the case for the ad inventory of users who frequently purchase a product after clicking on a Facebook ad.
Let’s take an ad from one of our agency’s brands, Fielder's Choice Goods, as an example. They sell wallets made out of vintage baseball gloves.
This ad is targeting 25–55-year-old baseball fans in the United States. The average order value for the wallets they sell is $150. The campaign objective we’re using is conversions, and we’re optimizing for purchases. The image below is demonstrating the lifetime metrics for this ad.
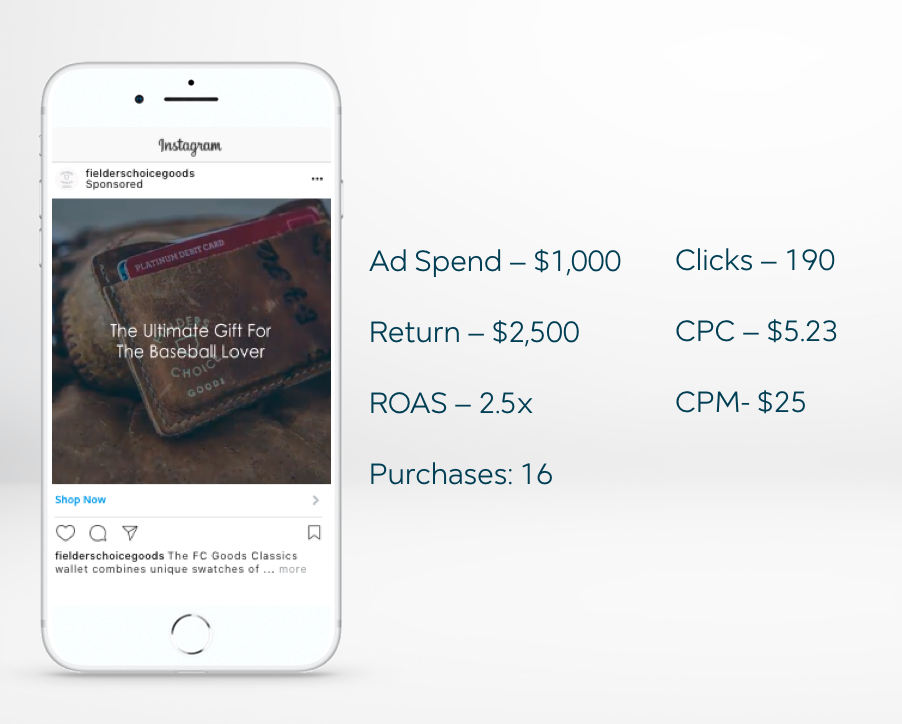
The CPM (cost per thousand impressions) and CPC (cost per click) metrics presented above for this ad would likely scare a novice media buyer at the beginning of this ad’s life. For example, some phrases I’ve heard echoing around the Facebook ad community for stats like this are:
“I can’t possibly win with $5 clicks. This ad is never going to get there.”
“$25 CPM? Facebook must think I have a bad ad and post-click experience. Let me check my relevance score…”
Imagine if you turned this ad off before giving it a fighting chance (I'll define this in a moment). This ad with “expensive clicks” and a “high CPM” ended up being one of the best ads in the account, with over $1,000 spent on it in its lifetime at a 2.5x return on ad spend (ROAS).
So how can you win with $5 clicks and $25 to reach a thousand eyeballs?
Reaching a high-converting audience (such as thousands of Sally Shoppers) is how you can win. The advertising real estate on Shopper Sally’s feed is going to be more expensive because this buyer profile is a high converter. It only makes logical sense Facebook would charge more to advertisers to reach highly converting customers since the competition to advertise in their feed is high.
For ecommerce advertisers, here are the best three ways you can make sure you’re reaching a high-converting audience:
-
Always optimize for purchase conversions in your ad set.
-
Vigorously test ad creative to find what is most relevant to your target audience. The higher the user value your ad generates, the more competitive your ad will be in the auction.
-
Make sure your bid is competitive for the target audience you are trying to reach.
If there are thousands of advertisers in the auction trying to gain one of Sally Shopper’s precious ad spots in her feed, you bet it’s going to cost a pretty penny to reach a high-converting user!
So is it worth it to advertise to Shopper Sally with her highly competitive ad space? The answer is yes, as long as the conversion rate is proportionally increased as the cost of ad space increases. In the ad example above, the ad received 190 clicks at an average rate of $5 per click, yet 16 of those 190 clicks converted for a 8.4% conversion rate from clicks to purchases. This is how we were able to generate a 2.5x ROAS with a $150 AOV for this particular ad.
The average sitewide conversion rate for Fielder’s Choice Goods hovers around 1.14% (see screenshot from their Shopify store below); however, the ad traffic brought in from this Facebook ad converted at nearly an 8x higher conversion rate.
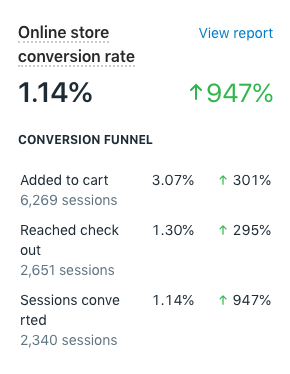
This is why CPC can be a misleading metric when evaluating Facebook ads, as it is often benchmarked against a website’s average conversion rate from all traffic sources. However, with a highly engaging ad being served to a target audience with the purchase-conversion objective selected, the conversion rate on that traffic can be much higher than the website’s average.
Exhibit B: Skeptic Scott’s Trash Traffic
Let’s look at another example of when CPC and CPM metrics can be highly misleading.
Introducing… Skeptic Scott! (below is an actual photo of our Director of Paid Media, Scott Kramer, who is a self-proclaimed skeptic).

Skeptic Scott represents another category of consumer you could advertise to. He’s a mid-30s American male who’s interested in fitness. He spends less than thirty minutes on Facebook and Instagram each day, often clicks on ads out of intrigue, but has never purchased from these ads as he prefers to do his shopping in person.
Generating “Skeptic Scott” traffic to your website through Facebook ads can send you all the wrong signals if you’re evaluating your ad performance by CPC and CPM metrics.
Let’s take a look at another Fielder’s Choice Goods ad below, to see why.
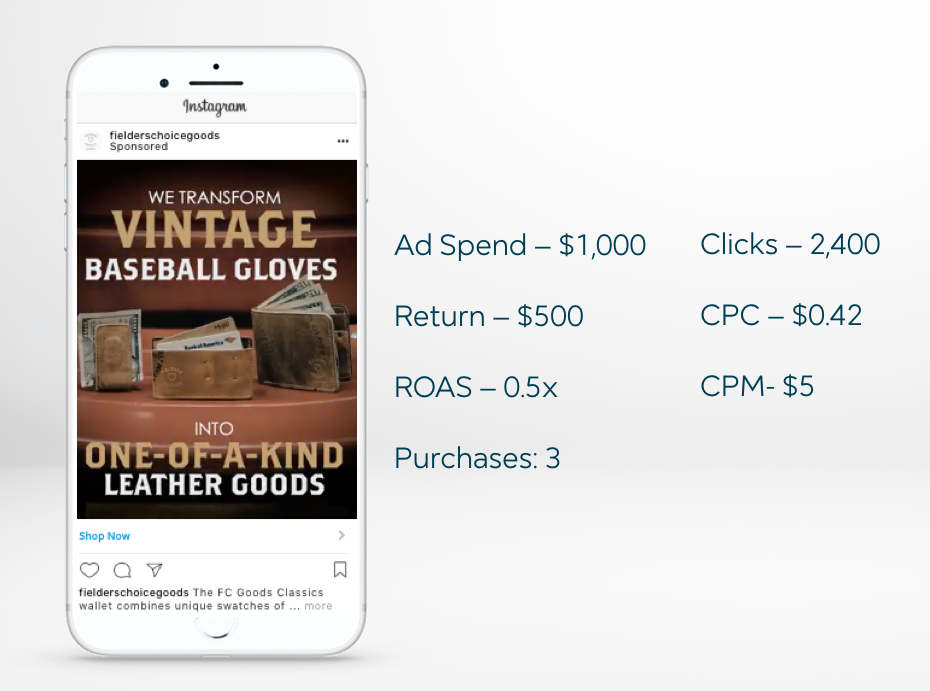
The novice media buyer proclaims:
“I’m getting sub $1 clicks! This ad is great at generating cheap traffic to my site, let’s increase the spending on this ad.”
“With a CPM this low, Facebook must love my product!”
The bottom line is cheap traffic is not always good traffic. Traffic is only valuable for ecommerce if the traffic your ad is driving has purchase intent. For the above ad example, the conversion rate on the 2400 clicks is 0.1%, which is over 10 times lower than the average sitewide conversion rate of 1.14%. If your site’s conversion rate and average order value takes a nosedive as you generate cheap traffic from Facebook ads, it can become really difficult to be profitable with your Facebook ads.
The two key differences between the first ad example with a 2.5x ROAS versus the ad above with a 0.5x ROAS are:
-
The ad creative (ultimate gift angle vs one-of-a-kind angle).
-
The campaign objective (conversion objective vs traffic objective).
This is why, for our agency’s ecommerce clients, we only optimize our campaigns for conversions with a purchase objective instead of link clicks.
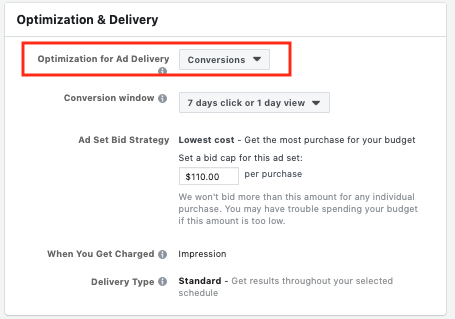
Why? Because our goal is to drive the most conversions for our clients at the lowest cost, not drive the highest amount of traffic at the lowest cost. In the first ad example, the CPM was $25 on the purchase conversion objective while the second ad has a CPM of only $5. However, the first ad generated over 5x more sales even with a significantly higher CPC and CPM.
There’s a logical reason why the CPM and CPC can be over quadruple the price of optimizing for purchase conversions vs traffic: it’s going to cost more to drive users with purchase intent to your site.
The best way to get the most purchases on your website is optimizing for the result you want: purchase conversions.
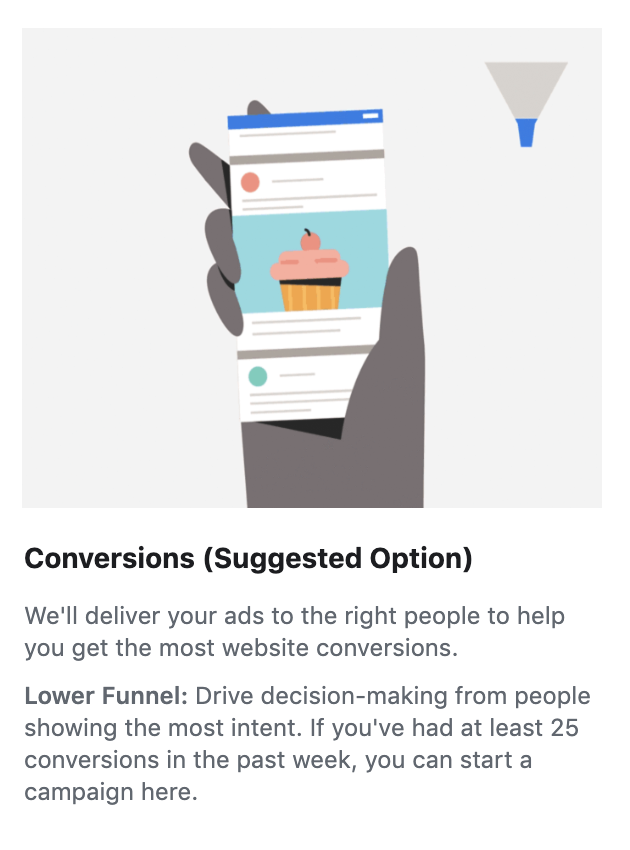
Facebook knows who’s most likely to purchase from an ad, engage with an ad, click an ad, or simply do nothing.
If you’re optimizing for link clicks, Facebook is great at finding the people who are most likely to click on your ad (like Skeptic Scott). However, if you're optimizing for purchase conversions, Facebook will show your ad to people who are most likely to purchase on your website.
The same goes for every other objective option you can optimize for.
This is why you should choose purchases as your conversion objective if that is your end goal. Although the CPC and CPM costs can be much higher with the conversion objective than optimizing for clicks, optimizing for purchase conversions will often lead to the highest possible ROAS for that ad creative and audience.
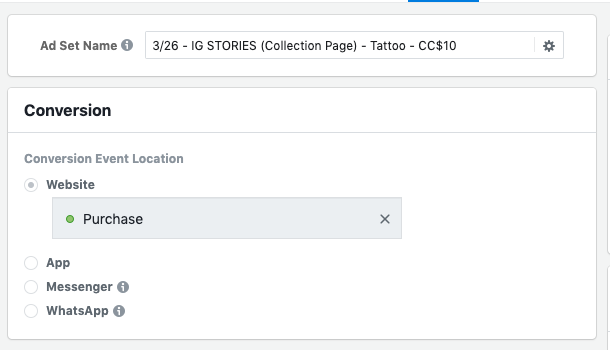
If your ad-buying decision-making is based on CPC and CPM metrics, you may find yourself in the trap of valuing cheap traffic over converting traffic. It can be completely worth it to drive expensive traffic to your site, if the conversion rate on those visitors is significantly higher than the conversion rate of cheap traffic.
What Analyzing $100 Million In Ad Spend Taught Us
I aggregated data across the 50 highest-spending ad accounts at Common Thread Collective, with over $100 million in ad dollars collectively spent last year. My goal was to uncover the trends between CPC, CPM, and ROAS.
If you’re following the logic from my Sally Shopper and Skeptic Scott scenarios above, these results are in line with my theory.
When analyzing these ad accounts, for the ads retargeting recent website visitors, the CPM for that traffic is over 4x the cost than targeting prospecting customers who have never been to the website. Not surprisingly, the ROAS for the retargeting ads is over 2x the return of the prospecting ads.
| Facebook Metric | Prospecting Ads | Retargeting Ads |
| CPM | $5.73 | $20.15 |
| CPC | $1.52 | $2.97 |
| ROAS | 1.89x | 3.91x |
It’s simple to see the reason why the average CPM for a highly valuable retargeting audience is quadruple the price of reaching a cold audience. But, we wanted to take proving this theory one step further and run a correlation analysis to see if there was any relationship between CPC, CPM, Relevance Score, and ROAS.
Key #3: Take CPC, CPM And Relevance Score Off Your Dashboard
A correlation analysis looks at the closeness of the relationship between two variables. For example, height and weight are related. Taller people tend to be heavier than shorter people. The relationship isn't perfectly correlated, but a relationship between the two variables does exist.
The data analytics team at Common Thread Collective calculated the correlation between CPC and ROAS. Warning: the results may be shocking to some readers.
In the data set of over $100 million spent on ads last year, there is zero relationship between CPC and ROAS.
To be more specific, the actual correlation between CPC and ROAS is -0.08. This is with all of the campaigns we analyzed being set to the purchase conversion objective as well. On top of that, we found that the same, close-to-zero correlation held true when analyzing ad accounts on an individual level.
To put this number in context, a perfectly correlated relationship between two variables is 1 or -1. A strong correlation would be considered a correlation larger than .50 or less than -.50. The correlation between CPC and ROAS of 0.08 is basically telling us that whether an ad has a high CPC or a low CPC, it’s not an indicator of future ROAS. It only gets slightly better for the correlation between CPM and ROAS: -0.12. This is still considered a very insignificant statistical relationship.[*]

So what does it mean with CPC and CPM metrics having almost no correlation with ROAS? Relating back to my Sally Shopper example, it means some ads can win with high CPC and CPM if the conversion rate of the target audience is high… which is why it is more expensive to reach that audience.
But the opposite can also hold true: ads with high CPC and CPM can be ads which rank low on Facebook’s “total value” equation and result in low ROAS. This is why CPM and CPC are terrible predictors of ad success.

There’s no metric that currently indicates whether the high CPC and CPM costs are because of poor ad quality, or whether it is more expensive because your ad is running to a high-converting audience.
Novice media buyers use Facebook’s relevance score metric for insight into whether Facebook’s algorithm is penalizing or favoring their ad compared to the competitive ads in that auction.
But relevance score couldn’t be more misleading of a metric. The most insignificant relationship among all the available Facebook metrics is the relationship between ROAS and relevance score: +0.04.
Relevance score is Facebook’s measure of the quality and engagement level of your ads. The relevance score metric aggregates various ad quality and relevance factors to give you an idea of how relevant your ads are to the people in your target audience, compared to other ads targeting that same audience. These factors include positive feedback (e.g., clicks, app installs, video views) and negative feedback (e.g., someone clicks "I don't want to see this" on your ad).

But don’t take my word for it that relevance score is a vanity metric. Read below for the updated explanation of relevance score in Facebook’s help center (I bolded the important parts for you):[*]
It's important to note that relevance score is an output, not an input. In other words, we aggregate the factors and convert them into the 1-10 scale in order to give you a general idea of your ad's relative relevance. However, when your ad enters an auction, the 1-10 number is not part of the "total value" calculation that determines which ad gets shown. Because of this (and the fact that the number is relative), we recommend not focusing too much on raising your relevance score. Raising it is not directly tied to improved performance. Instead, we recommend using it to get a sense of your ad's relevance, and then focusing on improving your targeting and creative.
If your ad has a lower relevance score, but it is yielding results, there may not be much of a reason to change anything. By improving its creative and targeting, you may be able to drive costs even lower, but we don't recommend making changes just to raise your relevance score. We recommend making changes to get more of the results you care about or to lower the cost of those results. If, in the process of doing that, your relevance score goes up, that's fine, but we recommend thinking of that as a byproduct of your changes, not the goal of making them.
To put the nail in the coffin, Facebook abolished the relevance score metric on April 30th, 2019 to replace it with more relevant metrics to show advertisers their ad’s true value ranking.[*]
Facebook says the single relevance score metric doesn't provide enough actionable insight, which is why it's switching to three new relevance metrics.
As per Facebook:[*]
Rather than measure relevance in one metric, over the next few months, we will replace relevance score with three new, more granular ad relevance diagnostics metrics. Similar to relevance score, these ad relevance diagnostics are not factored into an ad's performance in the auction. We think that this level of granularity will offer reporting that's more actionable for businesses.
So until Facebook releases more insight into actionable metrics, there is no reason to have Facebook’s three relevance metrics on your dashboard, as it is not a true reflection of your ad’s performance. There’s also no way to make practical judgments about the performance of an ad based on CPC and CPM alone, so you can remove those two metrics as well.
It doesn’t matter how much it costs to get people to click over to your site from your ad, all that matters is the conversion rate and order value of the users that ad generates. If the conversion rate and average order value are proportionally as high as the cost of your traffic, you can win.
Now you know what not to be looking at, let’s dive into the metrics you should be looking at on your dashboard to make ad-buying decisions.
Key #4: Track What Metrics Actually Matter On Your Dashboard
There is a golden rule to Facebook ads that has remained true throughout all of our ad accounts:
Ads that start out good (i.e. get at least 1 purchase within the first 1x AOV spend) will often remain good.
Ads that start out bad (i.e. 0 purchases within the first 1x AOV of spend) will often remain bad.
Here’s an example:
Good Ad Metrics
The ad below received 15 purchases within the first $100 spend, with strong purchase intent metrics:
-
Cost per unique add to cart: $1.17
-
Cost per unique checkout: $3.72
This is less than a third of the cost of my CPA target of $10.
The low cost per unique add to cart and checkout cost in relation to the CPA is a strong early indicator that this ad will continue to be successful over its lifetime.

Bad Ad Metrics
The ad below received 0 purchases within the first 1x AOV spend ($120), with weak purchase intent metrics:
-
Cost per unique add to cart: $29.77
-
Cost per unique checkout: $59.53
I have no reason to believe that this ad will ever hit success, so I will turn it off since it has no purchases yet. The cost per unique add to cart and checkout initiated is also very high, which is an early indicator of a bad ad. The cost per unique add to cart is nearly triple my target CPA of $10, and the cost per unique checkout initiated is almost 6x my $10 CPA target.

This might seem like an overly simplistic explanation, but it’s a highly reliable strategy to analyze Facebook ads. When I say ads that start out good, I’m talking about ads that are driving your optimization goal: purchase conversions.
When you launch a new ad set on Facebook, the way the Facebook auction works is it will try to find the lowest hanging fruit in that audience first. Facebook will show your ad to the people in that audience who they believe are most likely to convert.
We’ve found that over 85% of the time, when analyzing our best-performing ads across all ad accounts, ads that have reached success (in terms of ROAS target) in their lifetime have at least one purchase within the first X dollars of ad spend.
X is determined by the average order value of the product. If the average order value on my website is $50, I will let an ad run until it has spent $50, and if it does not have at least one purchase, then I can say with a very high degree of confidence this ad will never reach success if I let it keep spending.
Let’s take the example of Fielder's Choice Goods that sells the wallets made out of baseball gloves.

The average order value for each purchase is $150.
If I launch a new Facebook ad for this wallet, keeping in mind the average order value is $150, I will let this ad run until it spends $150 and then check if it gets a purchase.
If an ad does not get a purchase after spending 1x AOV (i.e. $150), I will turn off the ad. This is because I know the majority of ads (over 85%) that have reached my target ROAS in their lifetime have had at least one purchase within the first 1x AOV of ad spend.
I’m simply not willing to bet the less than 15% chance this ad will turn around and reach my target ROAS if I spend 3-5x AOV buying more data.
However, there are two metrics that can provide insight into whether your ad may drive purchases:
-
Unique Adds to Cart.
-
Unique Checkouts Initiated.
Unique Adds to Cart is a metric on the Facebook dashboard that is fired by the Facebook pixel when someone on your website has added something (or multiple items) to their cart.
Whether someone has added twelve items to their cart or one item, the unique add to cart metric is only referring to the number of people who add something to cart, not the number of items in the cart.
This is rather confusing because the regular “add to cart” metric on the Facebook dashboard is referring to the number of items added to a cart. Similarly, Unique Checkouts Initiated refers to the number of people who reach the checkout page.
Note: reaching the checkout page is not the same as a conversion. The checkout page is the page on the website where people can enter their payment information.
Unique Checkouts Initiated and Unique Adds to Cart have the strongest relationship with ROAS at a -.50 correlation, on average.
They are valuable metrics because they tell me whether my ad is driving purchase intent.
I couldn’t care less about the CPC, CPM, or relevance score metrics on my ad, but I deeply care whether my ad is driving potential customers down the funnel. Within the first 1x AOV of spend ($150 in this example of Fielder’s Choice Goods), I’m looking at the early indicators of my ad to consider if this ad is driving purchase intent.
Here’s a snapshot of my Facebook dashboard for one ad, with Unique Adds to Cart and Unique Checkouts Initiated:

I’m highly interested in the Unique Adds to Cart and Unique Checkouts Initiated metrics because I can predict from them the number of people who may end up purchasing. If I determine, on average, that 40% of people who add something to cart end up making a purchase of $150, then I can make some predictions with my unique add to cart data.
In the example above, 26 people added something to their cart. Considering the average add to cart to conversion rate of 27% (which can be calculated on your Facebook dashboard by dividing the number of Website Purchases by the Unique Adds to Cart count), I can predict that around 7 of those 26 people may end up completing their purchase within my default attribution window (28 day view, 1 day click).
The same theory applies to Unique Checkouts Initiated. If the checkout to purchase conversion rate on average is 90% (calculated by taking number Website Purchases divided by the number of Unique Checkouts Initiated), then I can predict that 7 of the 8 people who reached the checkout page will complete their purchase.
The easiest way to calculate your account’s average Unique Adds to Cart or Unique Checkouts Initiated conversion rate is by looking at your lifetime account data and dividing Unique Adds to Cart or Unique Checkouts Initiated by the number of Website Purchases.

In the example above you would divide lifetime Website Purchases in your ad account (3,917) by Unique Adds to Cart (13,760) to get the average add to cart to conversion rate (28%).
If you don’t have any Facebook account data to pull from, you will easily be able to determine this ratio after a few days running a new ad account. Or, you can analyze your online stores add to cart conversion rate to get baseline metrics.
Scale Your Facebook Ads Using The Three Facebook Metrics That Matter
Now you know what metrics to focus on, take these steps:
-
Remove CPM, CPC, and relevance score metrics from your dashboard.
-
Add Website Purchases, Unique Adds to Cart, and Unique Checkouts Initiated to your dashboard. Use these three metrics as the main indicator to kill or scale your ads.
-
If an ad doesn’t get at least one purchase after spending 1x AOV (and Unique Adds to Cart and Unique Checkouts Initiated metrics are not high enough to convert one sale), turn it off and launch a new ad creative or audience.
-
If an ad gets at least one purchase after spending 1x AOV (or Unique Adds to Cart and Unique Checkouts Initiated are high enough to convert one sale), let the ad spend to the next AOV (2x, 3x, 4x etc…).
To help you scale successful ads using these three metrics, I put together a calculator you can use to calculate kill targets for your ads. Simply enter your Facebook ad data and AOV into the calculator, and it will tell you when to kill or scale your next ad based on your target CPA.
Add A Comment
VIEW THE COMMENTS