If you’re an ecommerce entrepreneur or marketer and you want to increase your profits with better analytics, you’re in the right place.
Analyzing the ecommerce data of your business with Google Analytics is essential if you want to track, measure, and optimize your store.
In this post, you’ll learn about 10 important Google Analytics reports to review monthly for your ecommerce business, and how to use them.
You'll learn how to interpret that data and use it to inform changes in your ecommerce website to test.
To make sure you have examples from real reports, I'll use data from the Google Analytics accounts of a couple of unnamed Shopify stores.
We’ll also show you how to set up Google Analytics for ecommerce, in case you’re just getting started (skip this section if you already have it setup).
Here’s everything we’ll cover:
%(tableofcontents)
Google Analytics For Ecommerce Setup
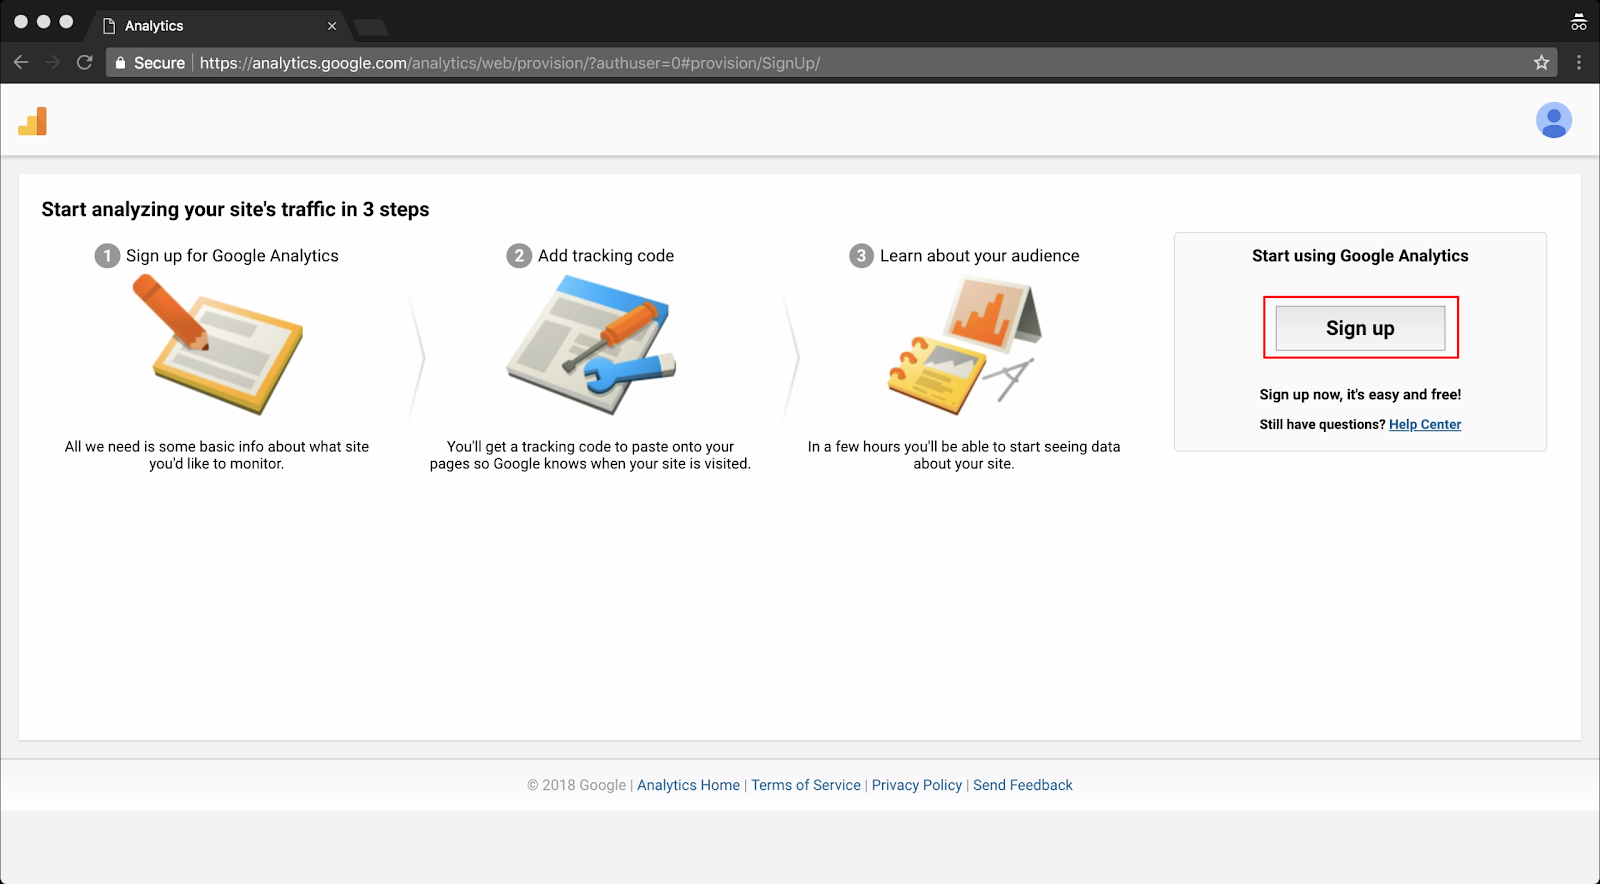
The first step is to navigate to analytics.google.com in your browser and Sign up.
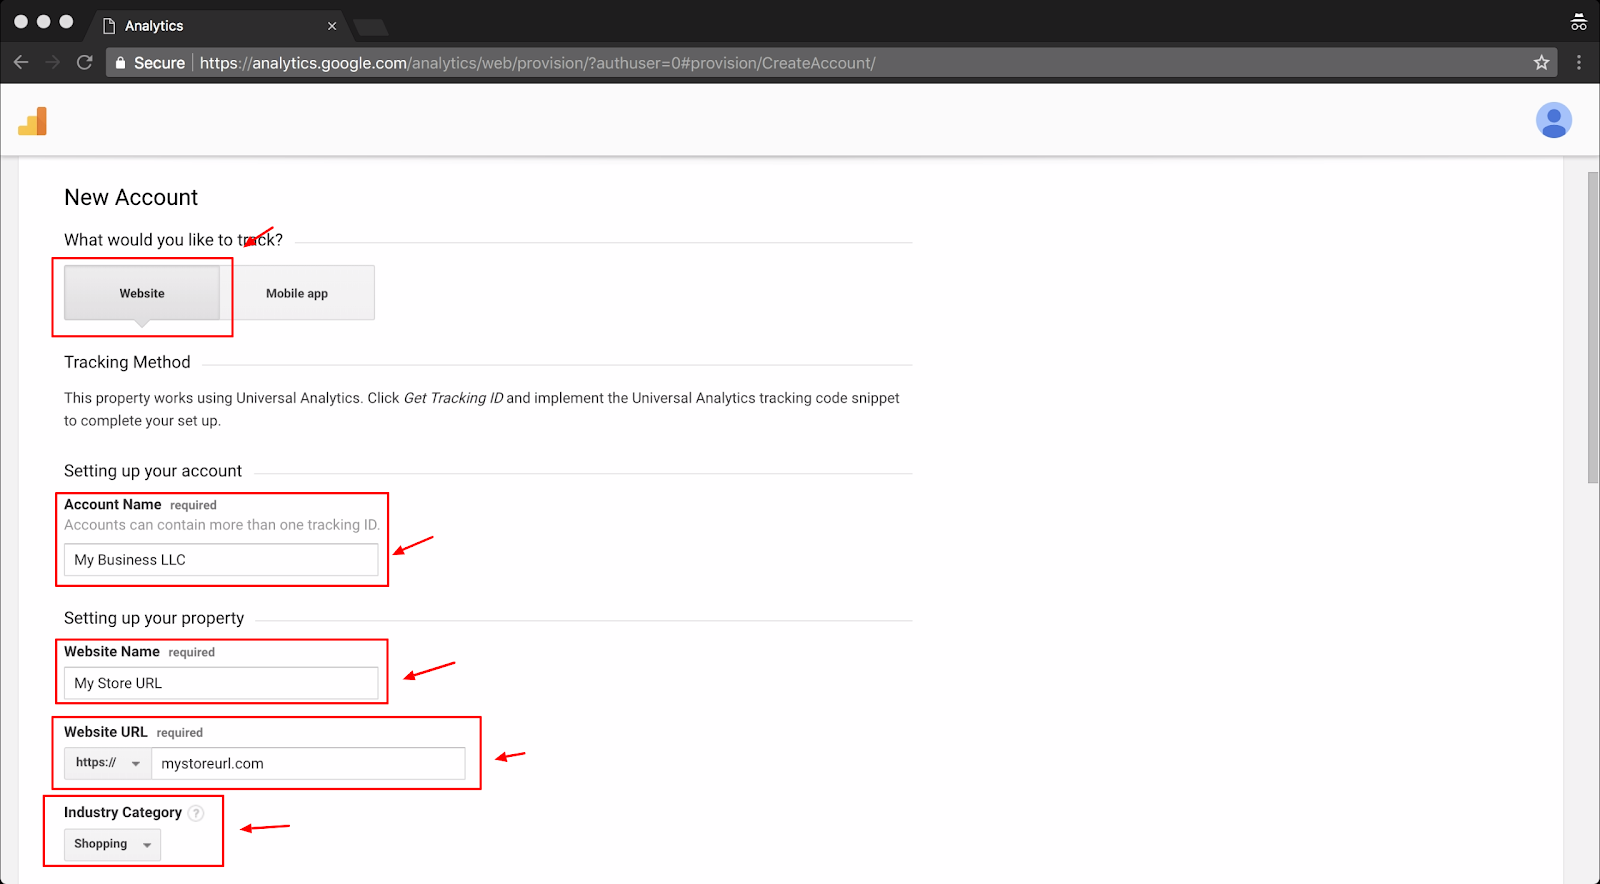
You want to choose Website, then fill in your Account Name, Website Name, Website URL and Industry Category as below.
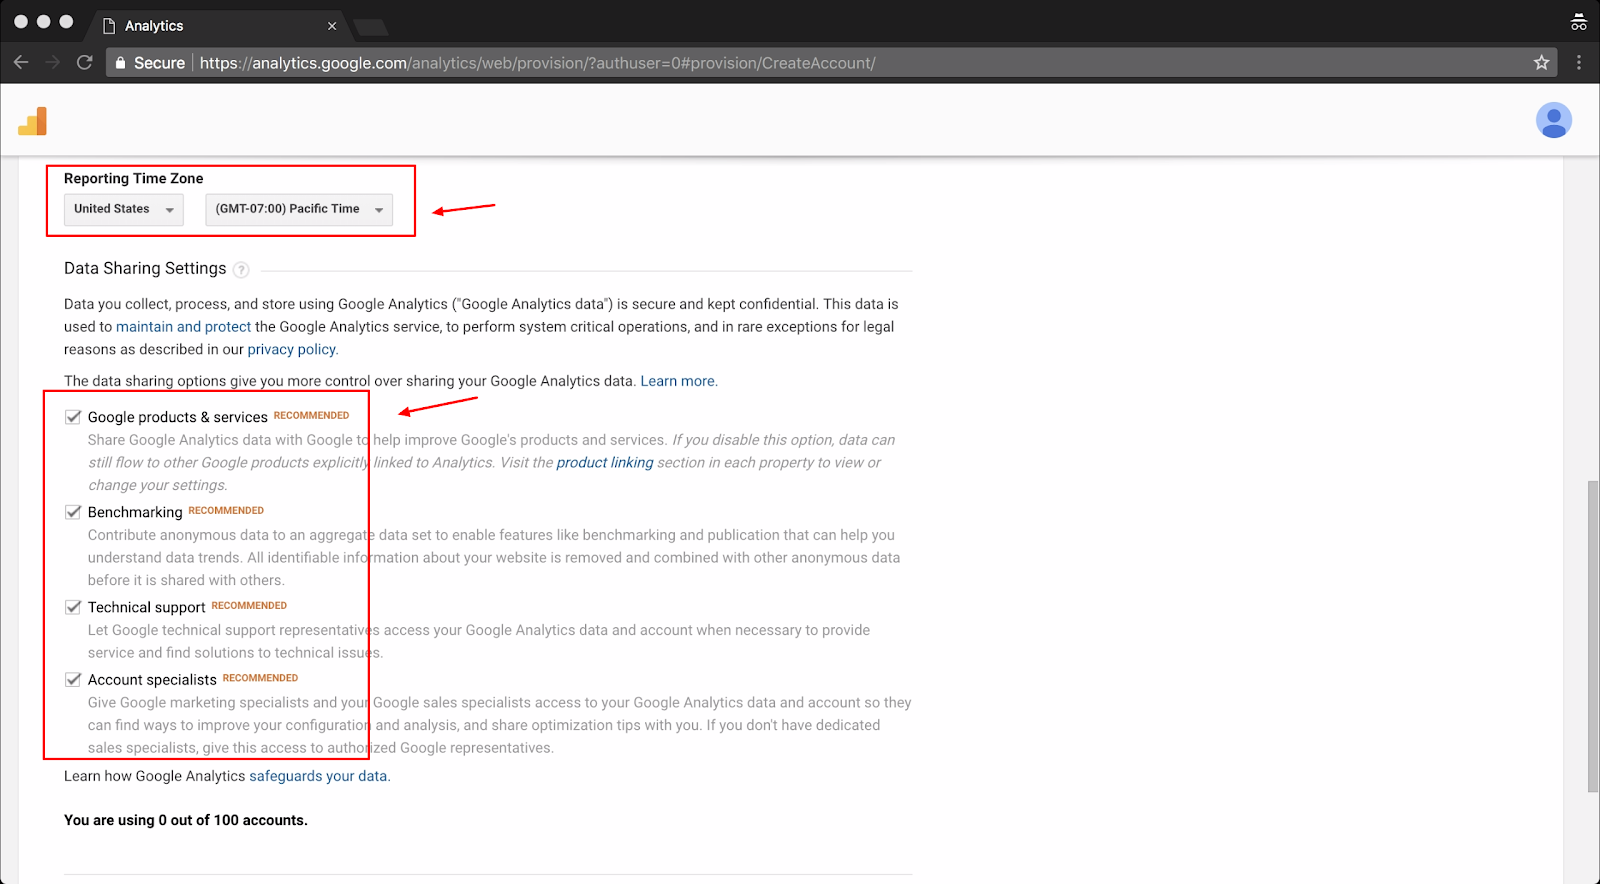
Choose your Reporting Time Zone and opt to share all your data with Google so they can make their products better and make you more money.
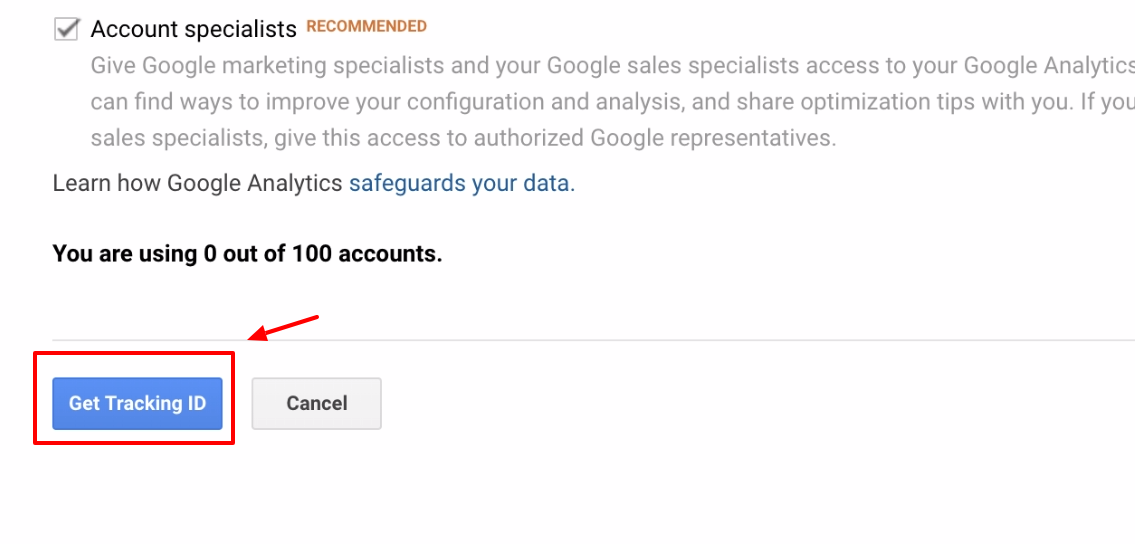
Next click Get Tracking ID.
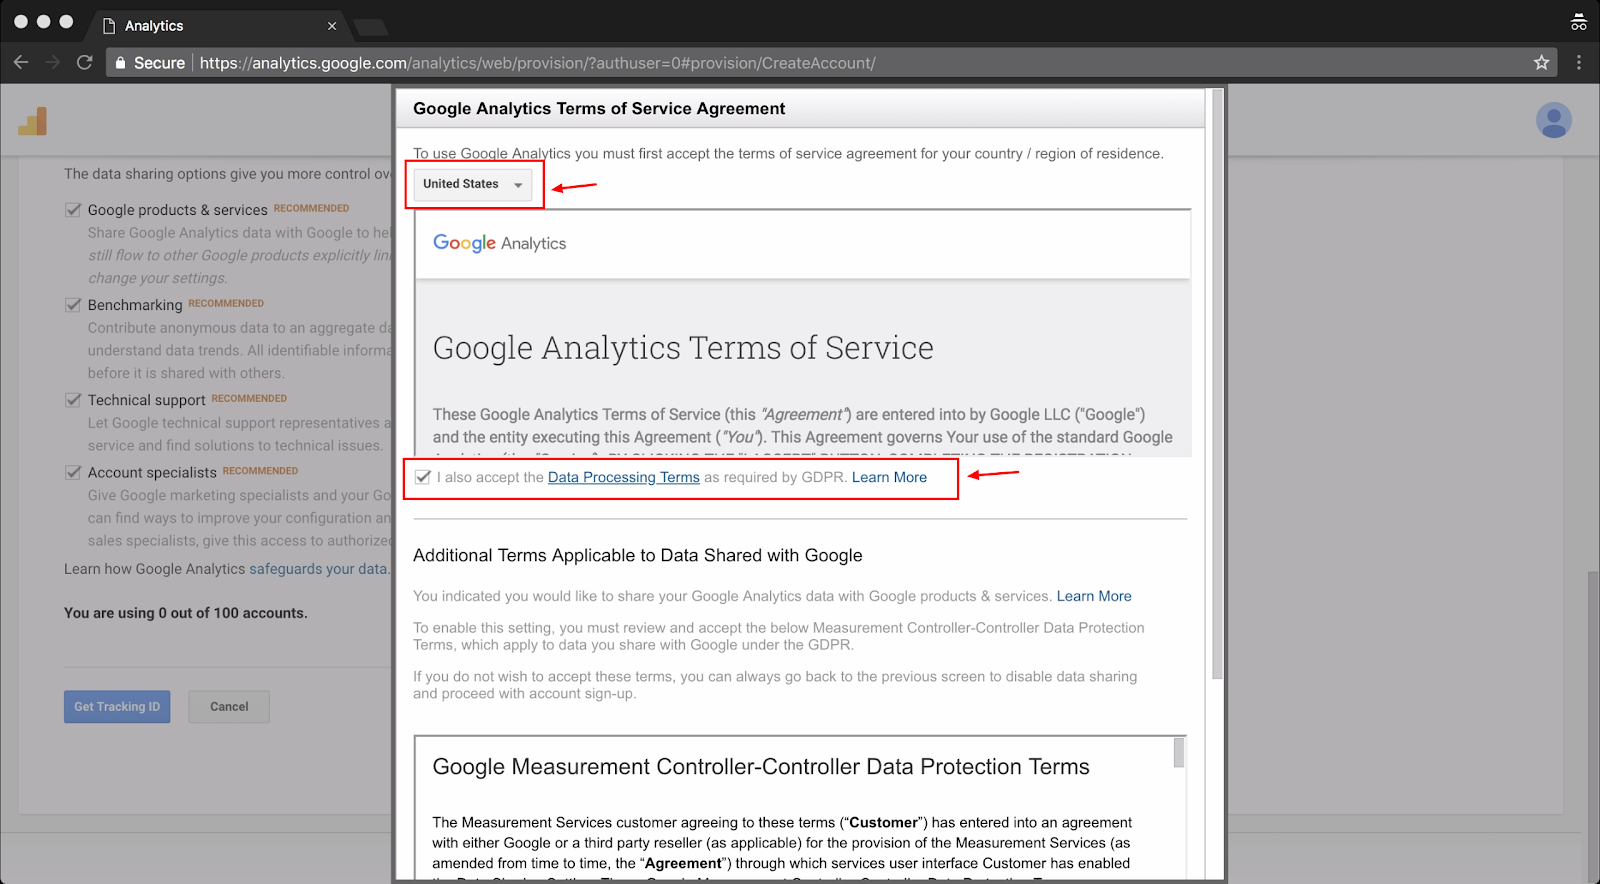
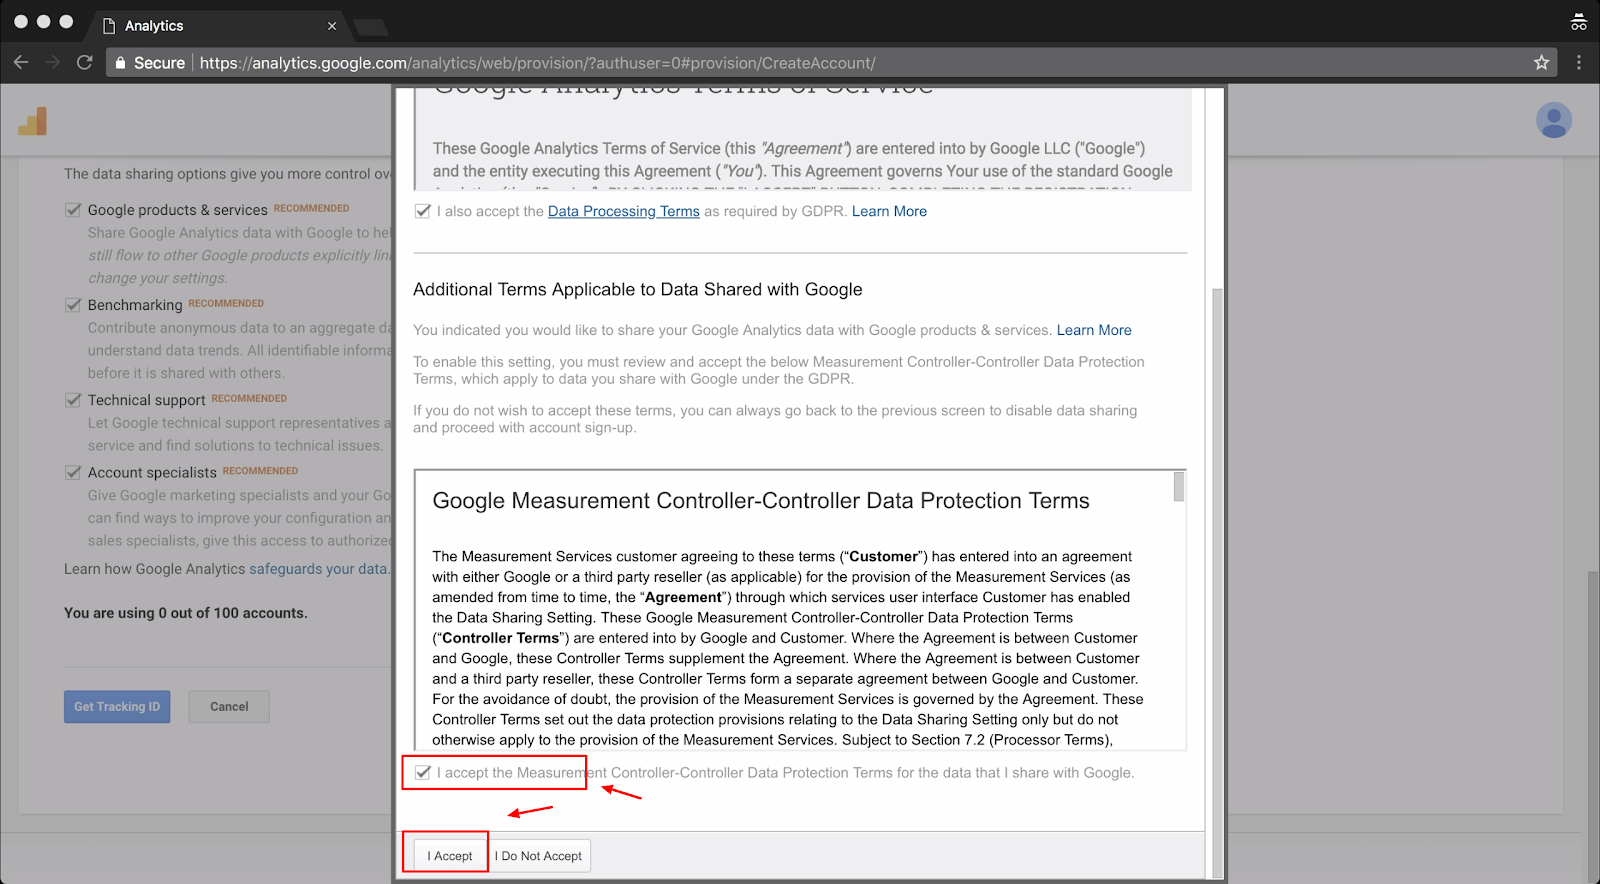
Agree to the terms and conditions by ticking the checkboxes, and clicking I Accept.
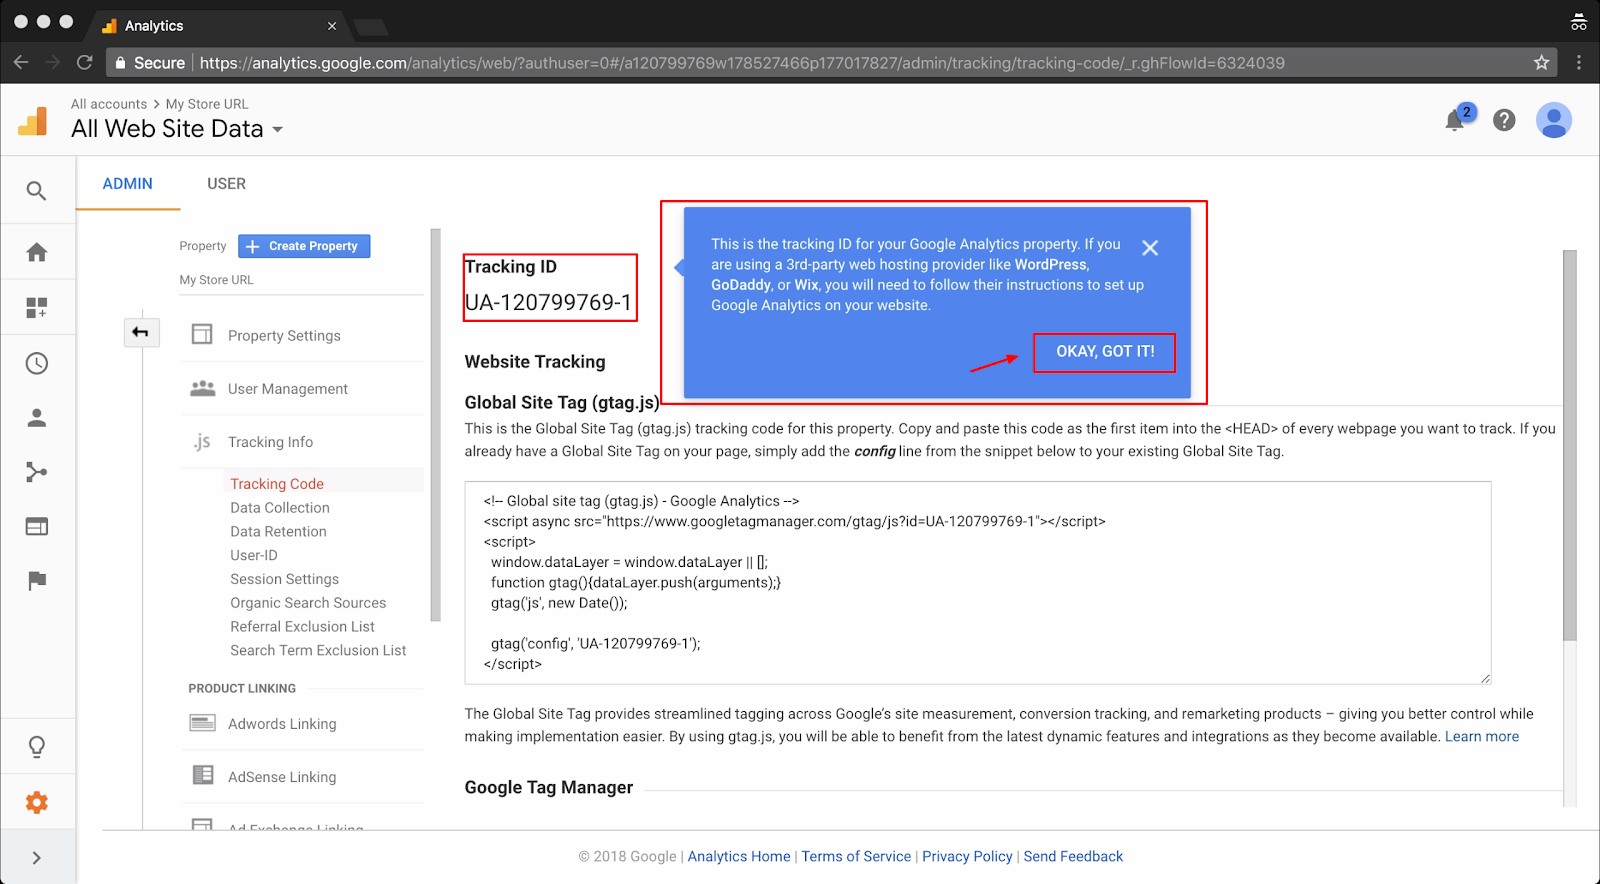
Now you can grab your Tracking ID and add it to your store. If you ever need to find this again you can go into your Google Analytics, and click on Admin > Tracking Info > Tracking Code.
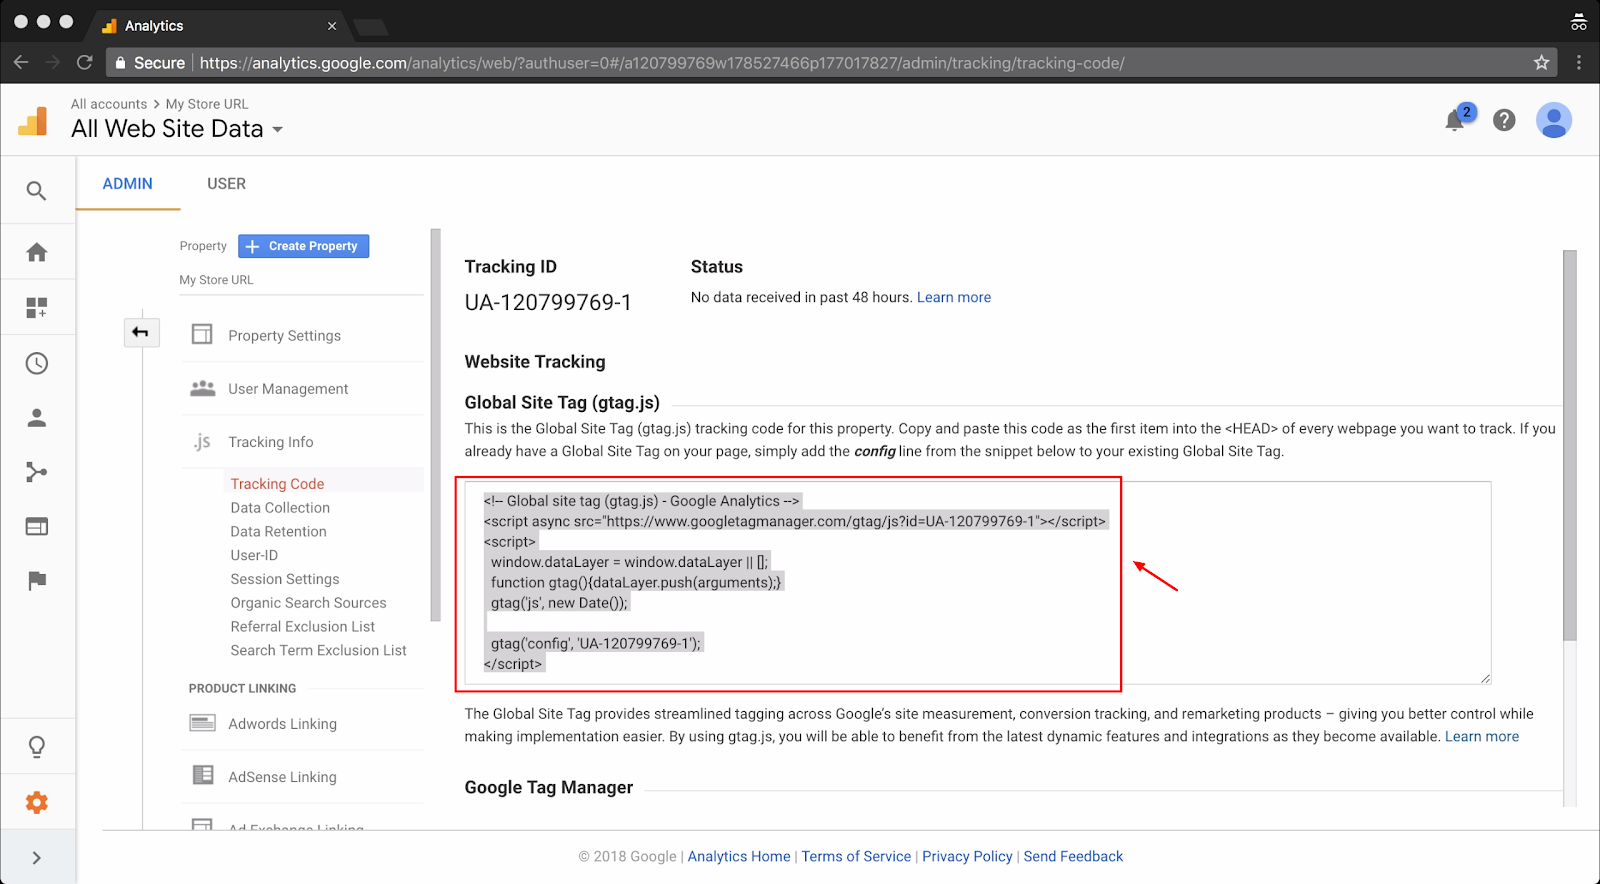
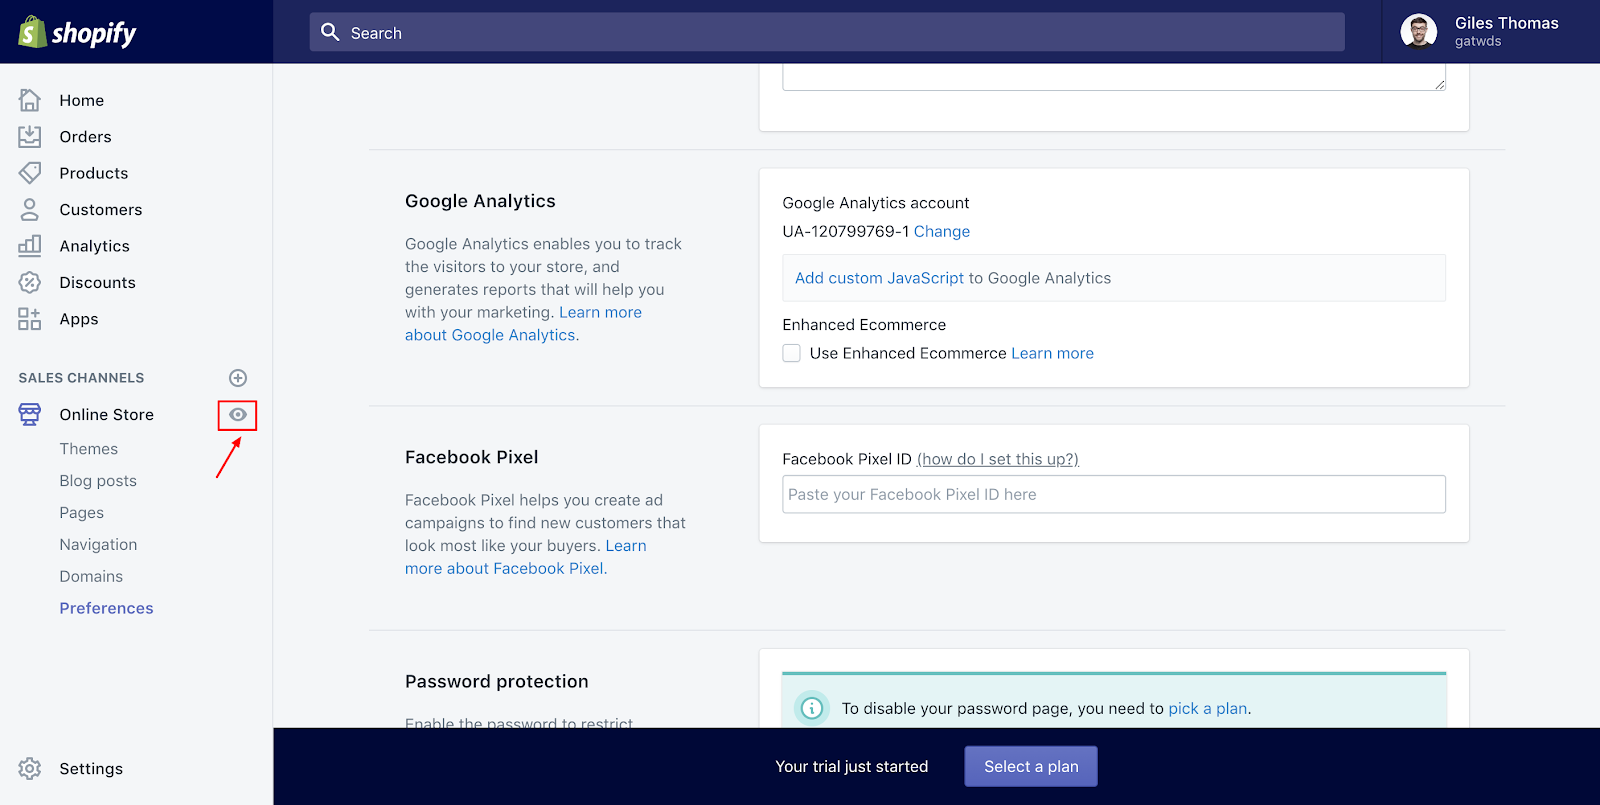
To add it to your Shopify store navigate to Online Store in the Shopify admin. Then click Preferences. If you don’t use Shopify, you’ll find a similar section inside your ecommerce platform. If you can’t find it, email their support team to ask.
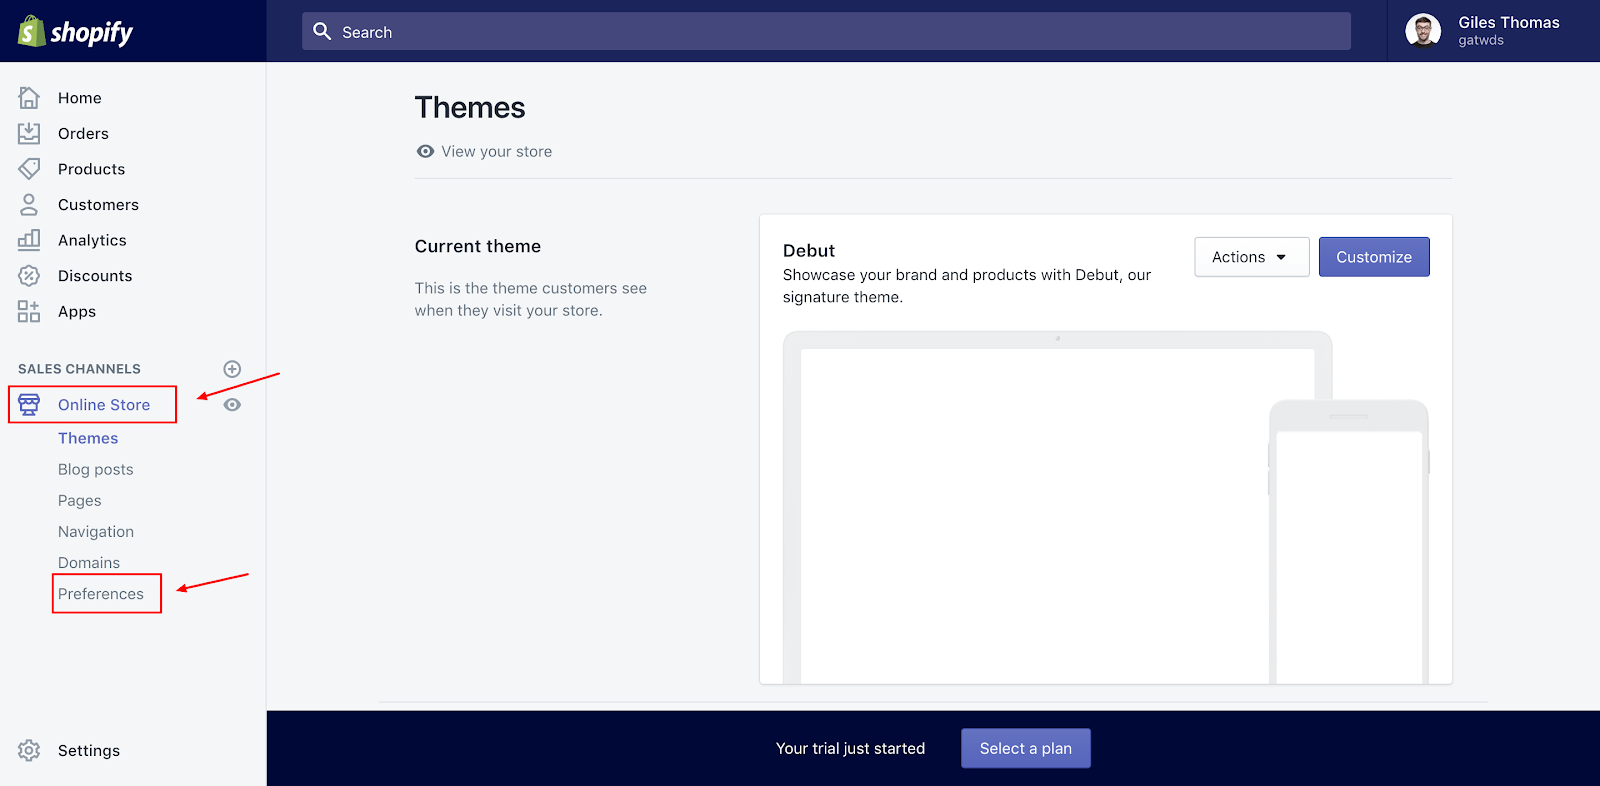
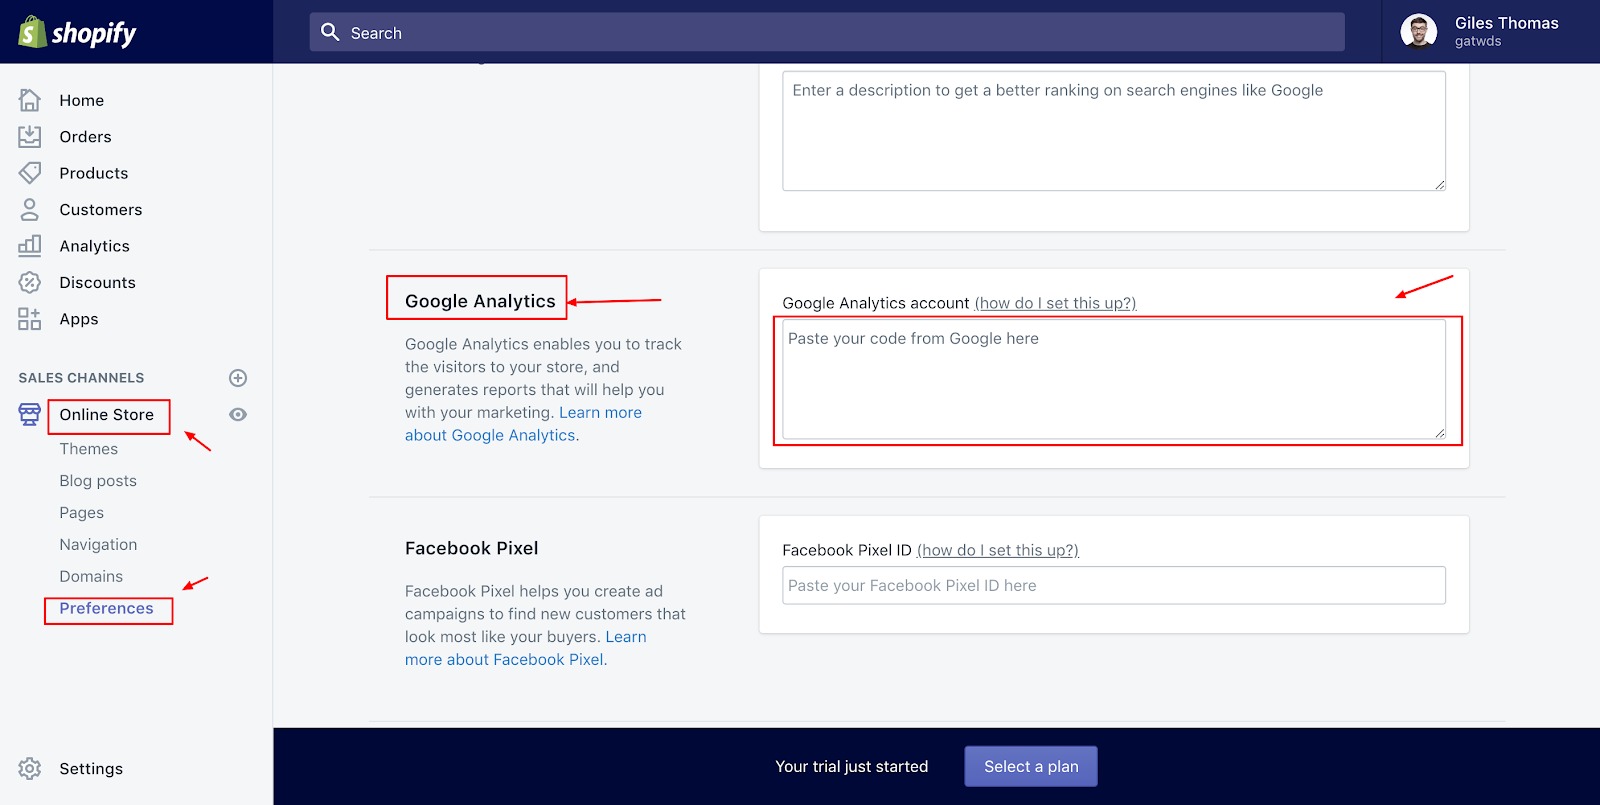
Scroll down to the Google Analytics section and paste in your tracking ID.
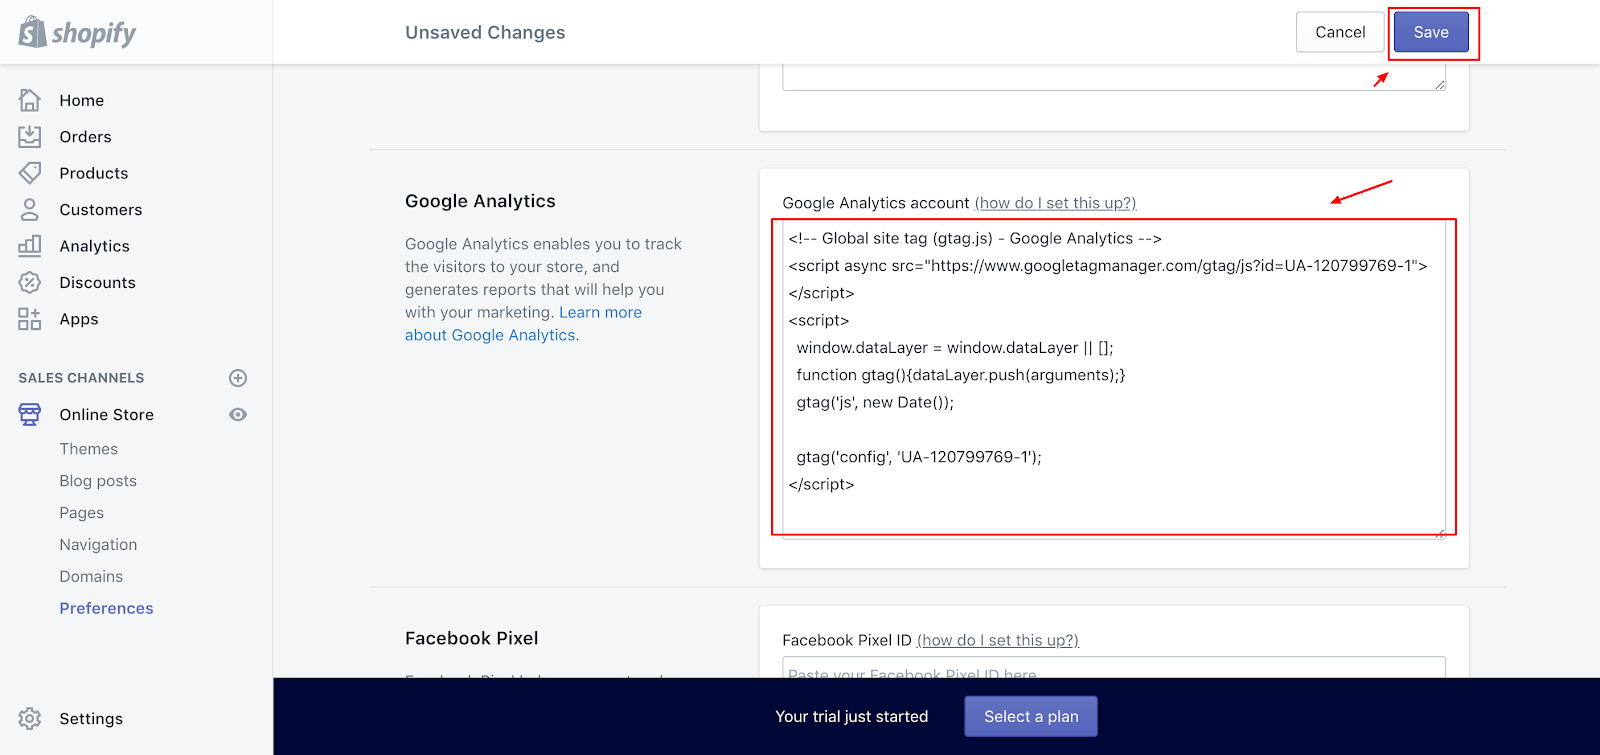
Simply paste it in and click Save at the top of the page on the right hand side.
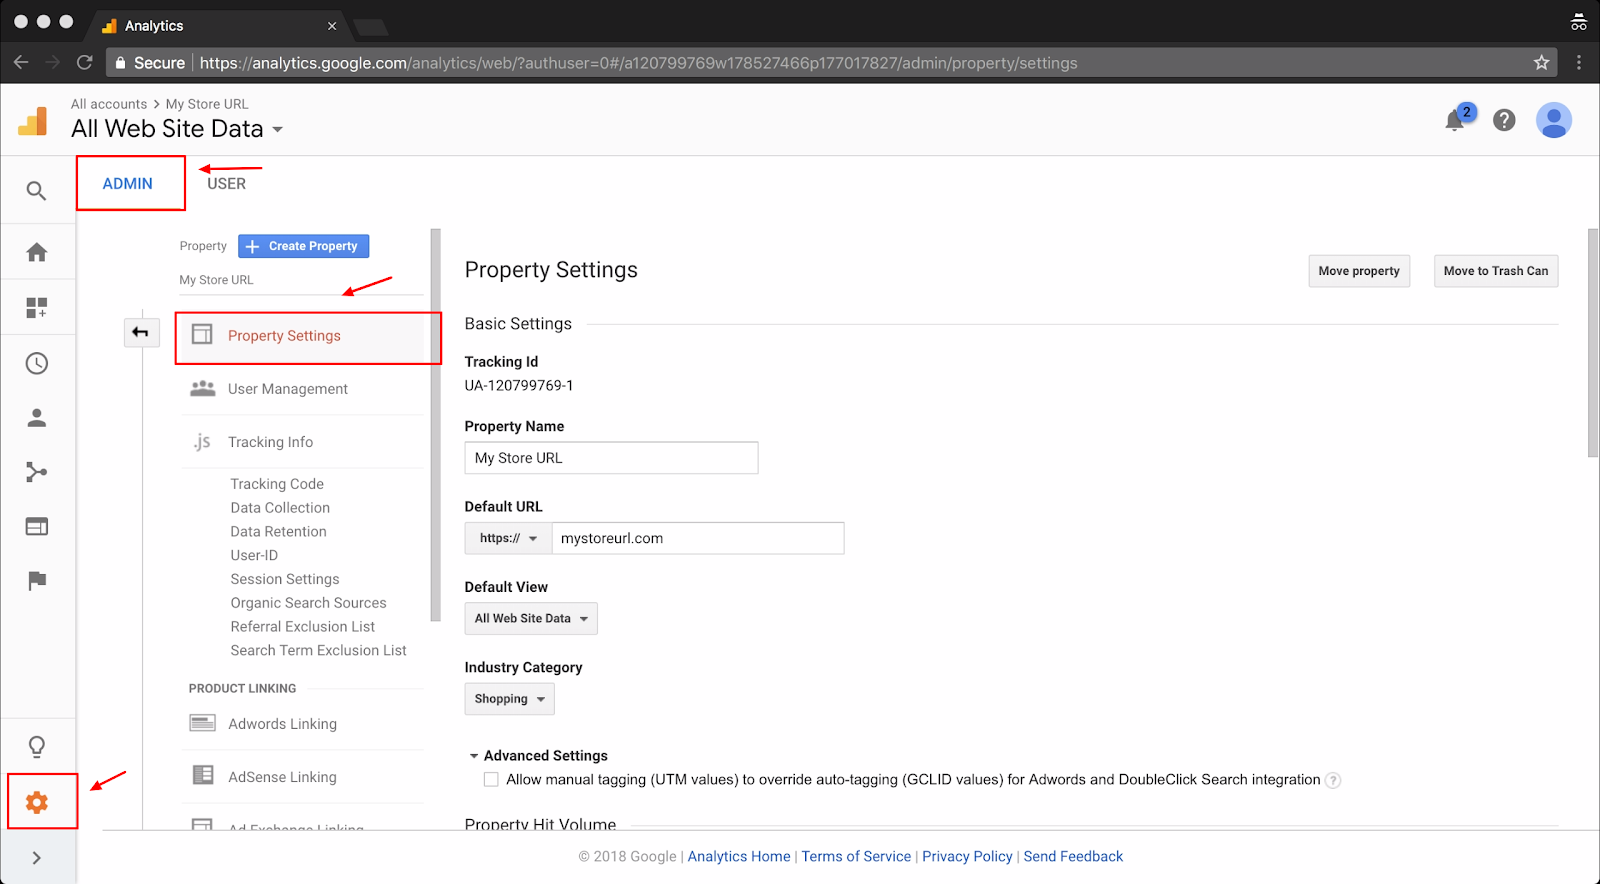
Next we can amend some of the Google Analytics account settings to make sure you are capturing the right data.
First go to Admin > Property Settings.
Then check Property Name, Default URL and Default View match the values below (using your own store URL).
Next, scroll down and make sure Enable Demographics and Interest Reports and Use enhanced link attribution are checked.

Then scroll further and make sure Enable Users Metric in Reporting is checked.
After click on Adjust Search Console and make sure your Google Analytics is connected to your Google Search Console account.
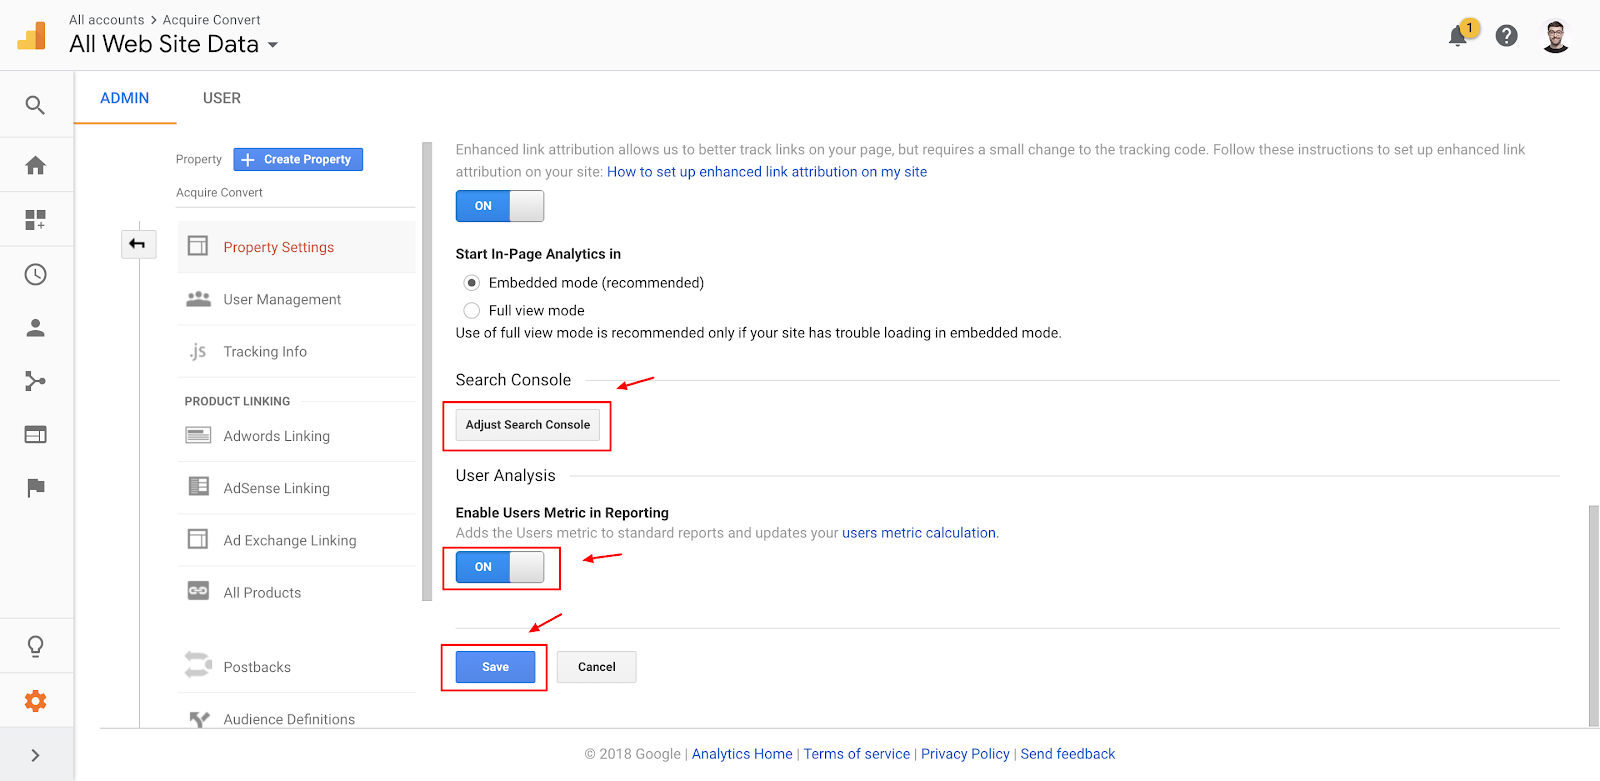
Pick your domain name and click Save. If you don’t have a Google Search Console account, you can set one up at google.com/webmasters/.

Next navigate to Admin > Ecommerce Settings.
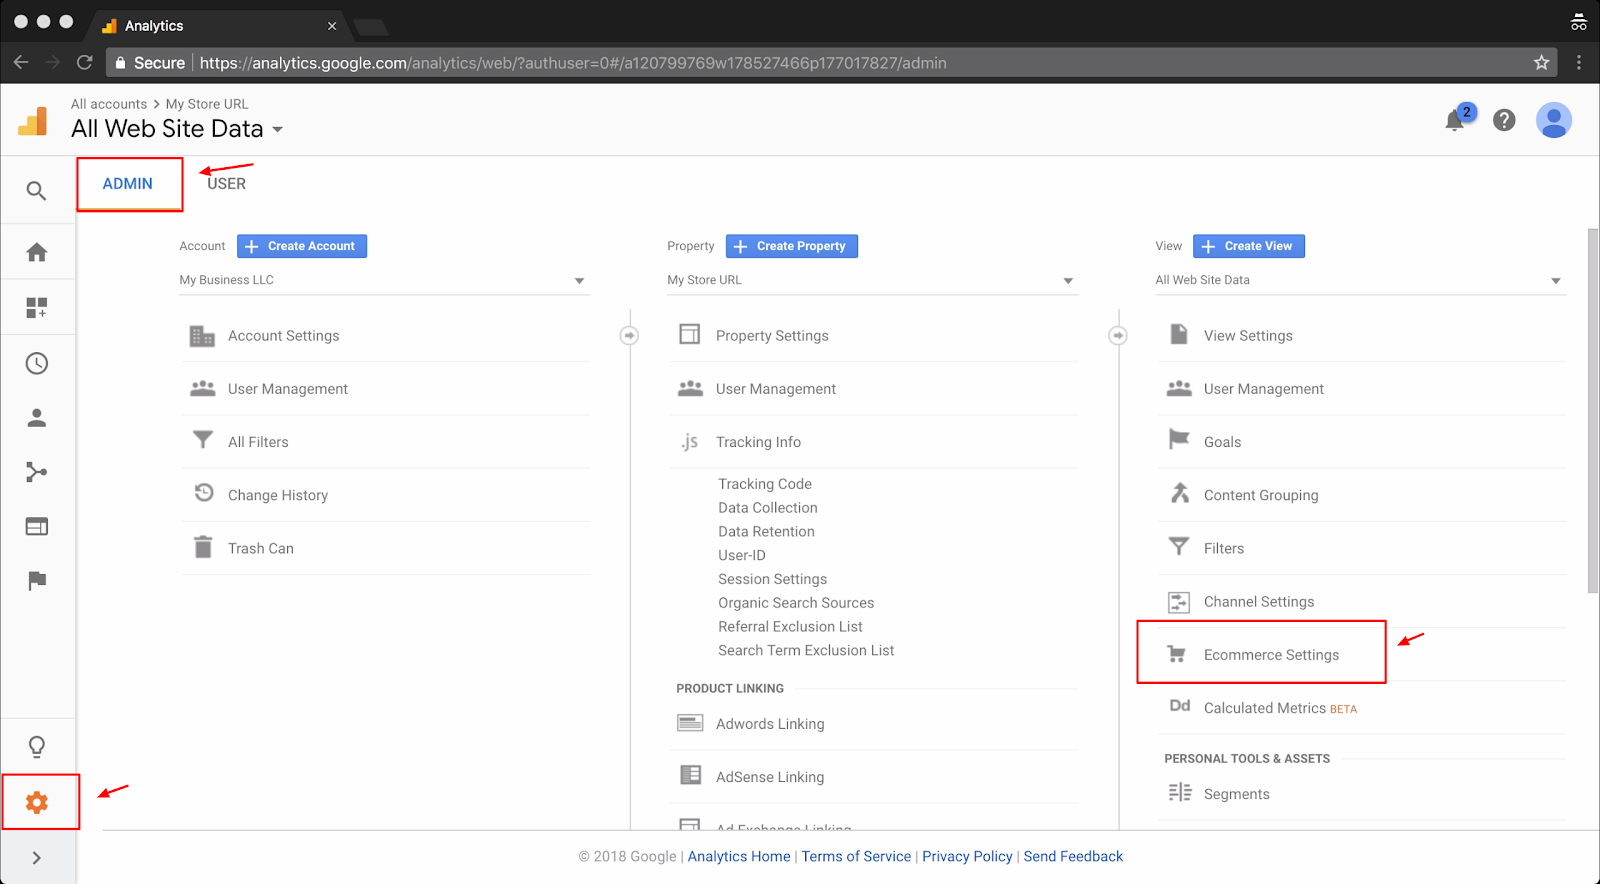
Make sure you Enable Ecommerce and click Save.
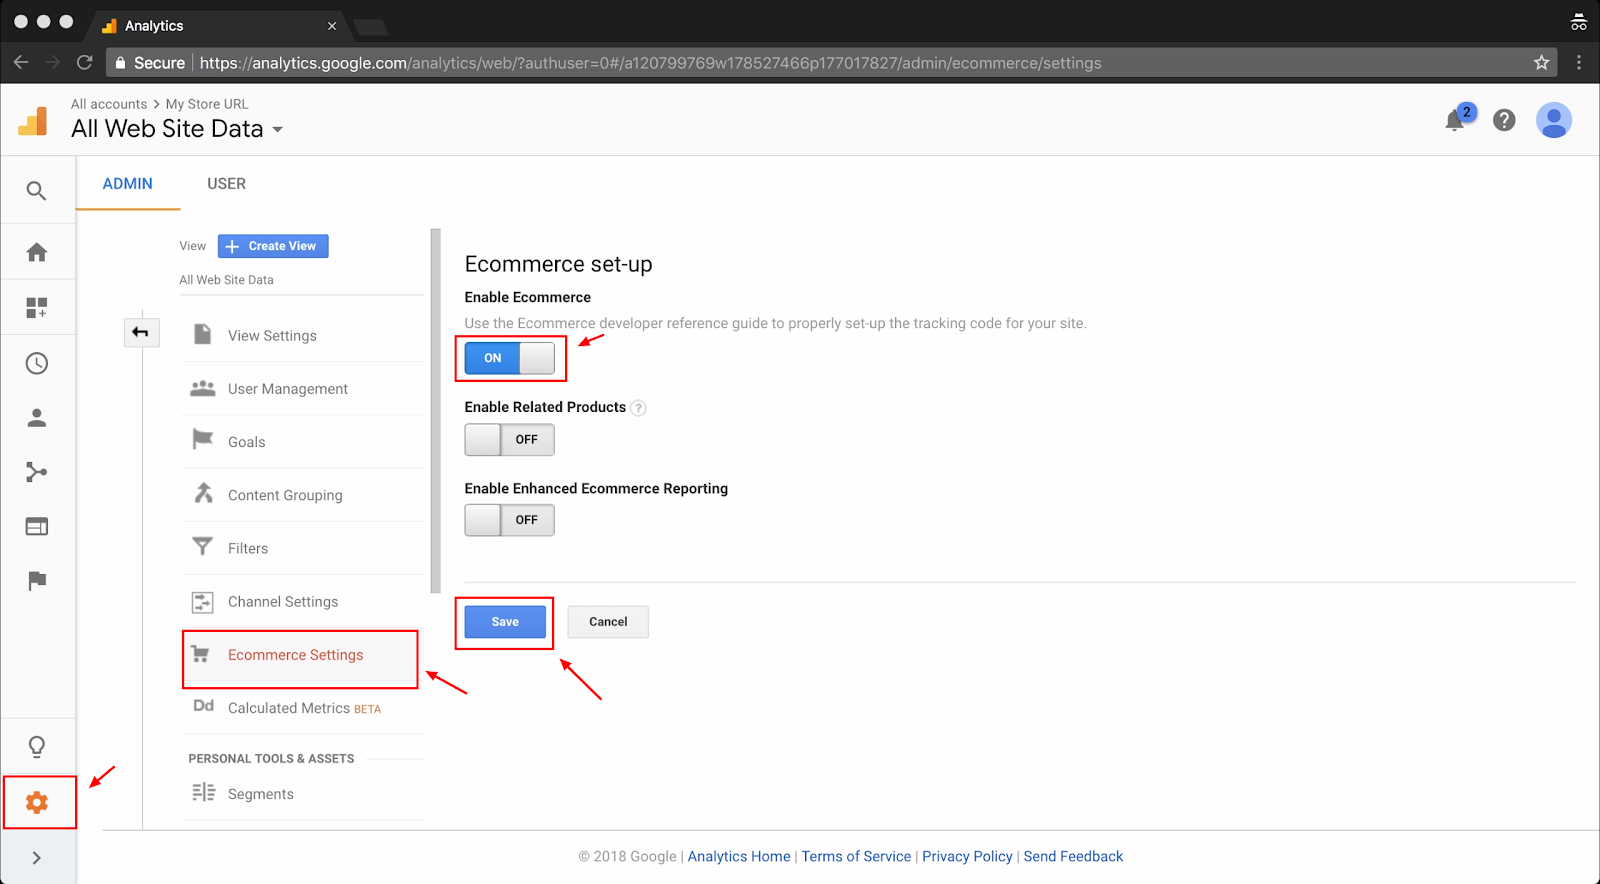
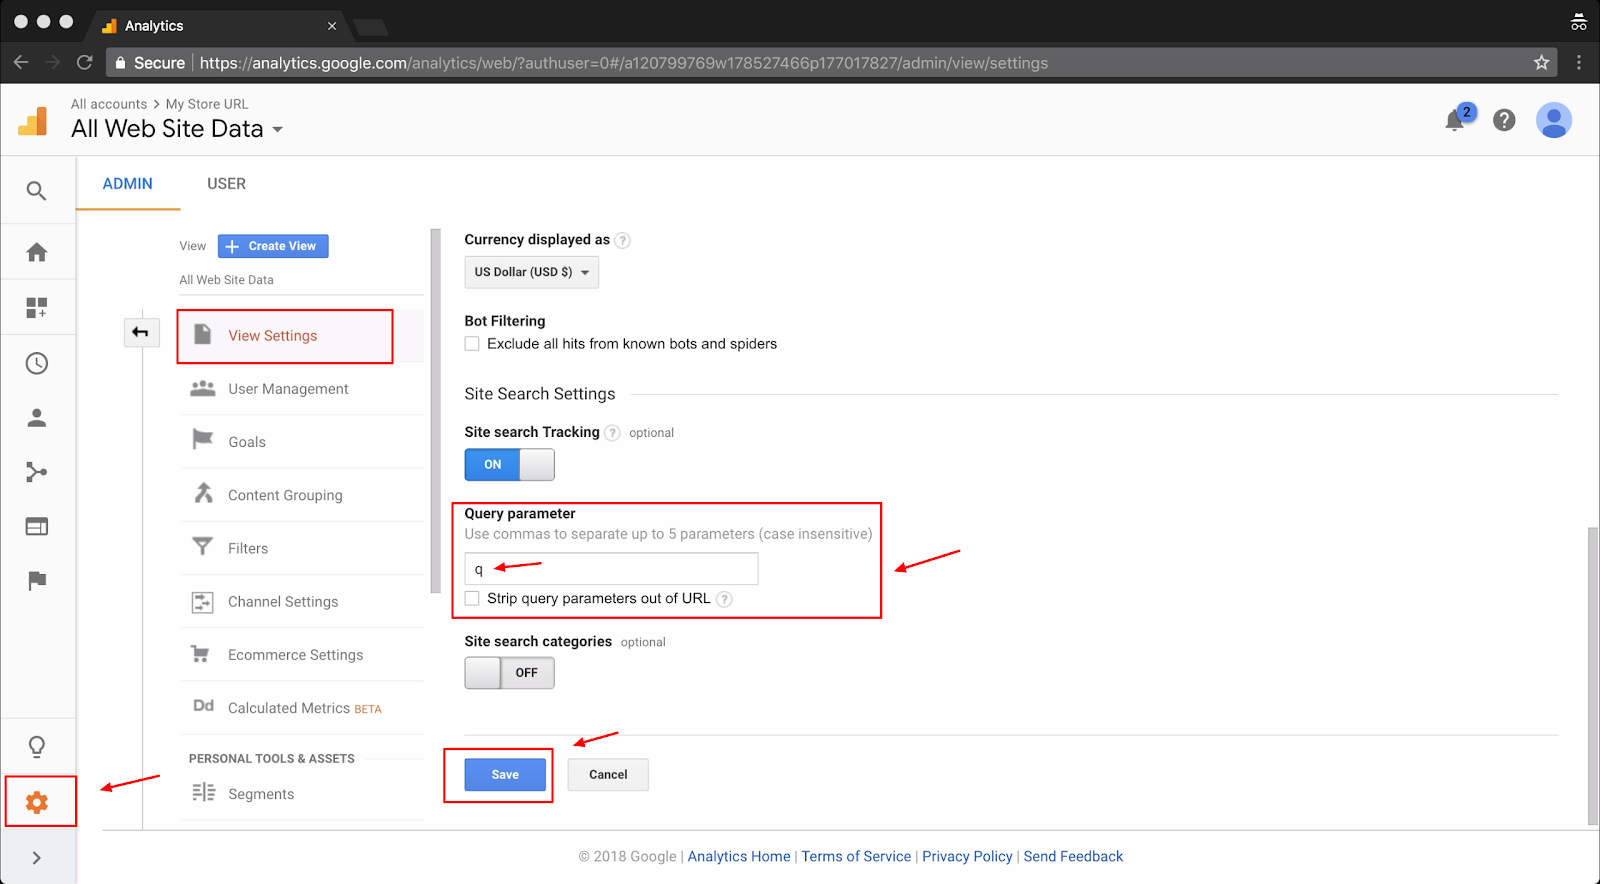
To record the search terms people type into your store’s search form, go to Admin > View Settings, enable Site search Tracking and for Shopify write the letter q in the form field Query parameter. For WordPress this is generally s.
To find your search query parameter just search for something in your store and look in the URL for a letter before for the = sign as below.

Now navigate back to Shopify and click the view eye next to Online Store.
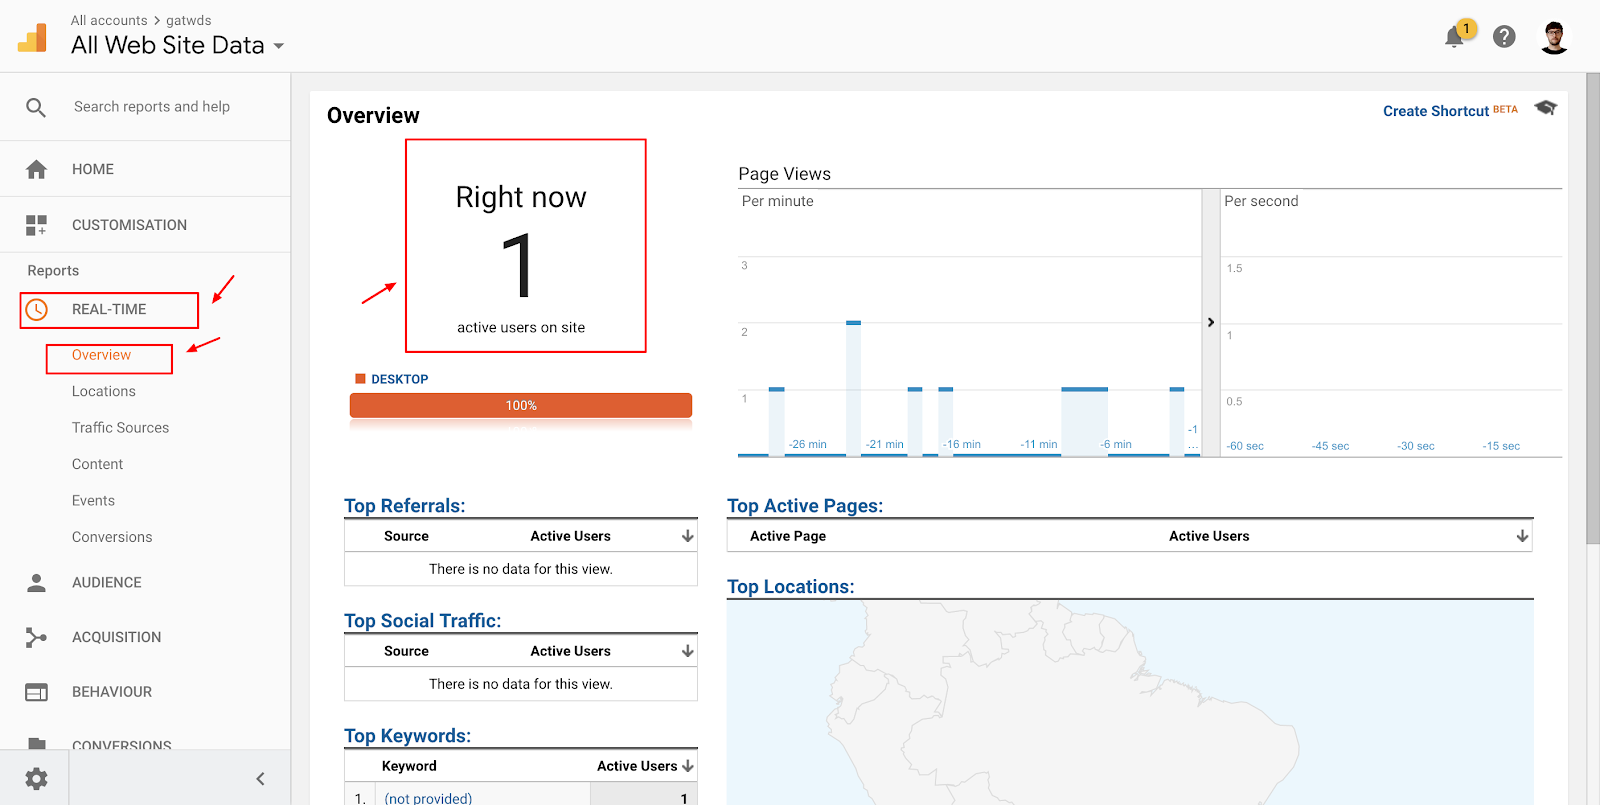
Then go back into Google Analytics and click on Real-Time > Overview and make sure you can see 1 person viewing the store.
That person is you!
Now you know the visits are being recorded.
Now, let’s study the different reports you can use to grow your ecommerce business, based on your Google Analytics data.
Demographics: Age Report
The demographics report is a great way to test assumptions around your customer persona, that’s your ideal target customer, and find out who is really buying from you.
Note: To view the demographic data, Demographics and Interest reports need to be enabled in GA. Don't enable this until you've complied with the necessary requirements (regarding privacy and notification) that Google and your local government have put forth. The reporting needs to be enabled for at least one month before you can review the data. Here is how to enable the report.
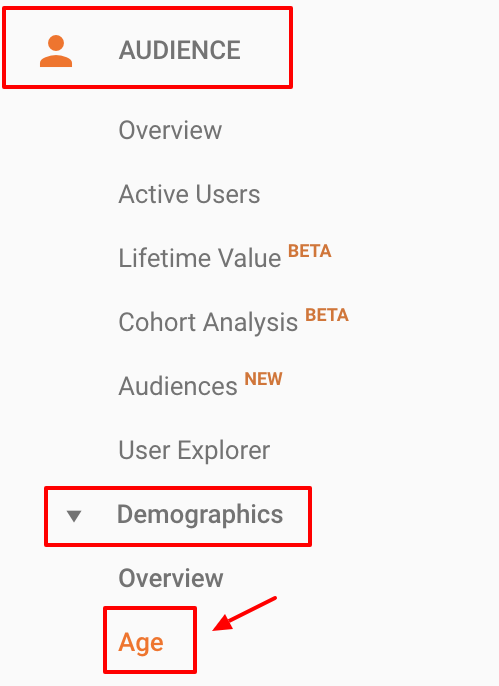
Navigate to Google Analytics and select: Audience > Demographics > Age.
Select the most recent, complete three-month period in the report date picker. For this post, the examples will use data from March 2018 through May 2018.
Open the date picker, choose the last three-month period, select Apply, then select advanced.
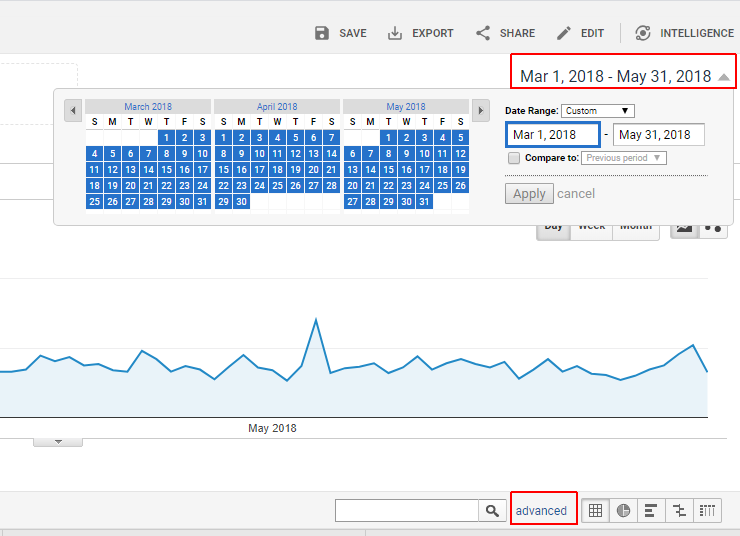
Note: In this report under the advanced settings Exclude: Sessions; Less than: 1000.

If you have a lot of traffic, like more than 100k sessions per month, change the value for excluding sessions to be less than 2.5% of your total monthly session count. This will remove any age brackets where the data sample size is too small to be classed as statistically significant. You'll be doing this for most of the reports in this post. You can skip this step if you have less than 2k visitors per month.
Then click Apply.
Here are our results:

How To Use This Report
Find the age bracket with the highest conversion rate
Sort by E-commerce Conversion Rate. You're trying to find which age group converts best for your store.
-
Does this match with your customer persona? Are you targeting the right age segment in your marketing and messaging?
-
Why would people in this bracket convert better? Does your value proposition speak to them more directly?
Find the age bracket with the most transactions
-
Are you targeting this demographic with paid marketing? Test your ad copy, age range targeting, and creatives so they match the age range that drives the most revenue to your business.
Calculate average order value by age bracket
Divide the total revenue value by the number of transactions for each age group.
-
Do certain age groups spend more with you per transaction? Try to narrow down your customer persona to your ideal and most profitable customer. The average order value of your store can greatly affect your per-transaction profit.
Find the age bracket with the highest bounce rate
-
How can you improve bounce rate for this segment?
Extra credit: Go through the same process for your gender report. Does your business skew towards one gender? Is your brand positioning and messaging relevant to this skew?
Click here to import the Demographics: Age report into your Google Analytics.
Geo: Location Report
The Geo report is a great way to learn which locations generate you the most revenue.
Note: In this report under the advanced settings Exclude: Sessions; Less than: 1000.
Navigate to: Audience > Geo > Location.
Select your country with the most visitors:

Review your top locations.

How To Use This Report
Find top locations by users
-
Use this data to inform offline marketing activities.
-
Target these locations in your paid marketing efforts.
Find top locations by conversion rate
-
Use JavaScript to sniff the location of visitors and consider serving them personalized messaging to improve these locations. For example, you could add a line 'We ship to [location]' on the cart page, to reassure shoppers you offer shipping to their state. You can use an app like GeoLizr for this!
Click here to import the Geo: Location report into your Google Analytics.
New vs. Returning Report
This report is great for understanding the behavioral difference between new and returning visitors. Primarily the difference between their conversion rates.
Navigate to: Audience > Behavior > New vs. Returning.
Then look at the report:

How To Use This Report
Find conversion rates for new vs. returning visitors
-
If new visitor conversion rates are well below return visitor conversion rates, think about how to treat them differently on your homepage. You could cookie visitors and serve two different variations of your homepage, one optimized for new visitors. This could include a more in-depth value proposition or even coupon codes or one-time new customer offers.
Example: We tested this on a Shopify store recently. The hypothesis for this test was to create a more in-depth homepage for new visitors, and to increase new visitor revenue.
This saw a 14% increase in overall revenue, and a 94.96% increase in revenue per visitor for new visitors (with a 98% confidence).

Click here to import the New vs. Returning report into your Google Analytics.
Browser Report
In this report you are going to learn how different browsers and devices are performing on your website in terms of conversion rate. By looking at these reports, you can learn which browsers need further browser testing.
You will see if there are functional errors for specific browsers or browser versions, and how important mobile is for your business (my guess is it is really important!).
Navigate to: Audience > Technology > Browser & OS.
How To Use This Report
Segment the data.
Make sure the last 30 days are selected in your date range selector in the top right-hand corner of the page, then select advanced, and fill out the advanced menu as below:

You will now only see browsers with more than 500 new users per month.
Find top browsers by conversion rate.
Make sure that the Conversions select menu is set to Ecommerce and then click on the Goal Conversion Rate column header to rank the browsers by conversion rate best to worst.
The highest conversion rate should be at the top of the page.
Again look at this report. Are there any browsers with very low conversion rate compared to the average rate?
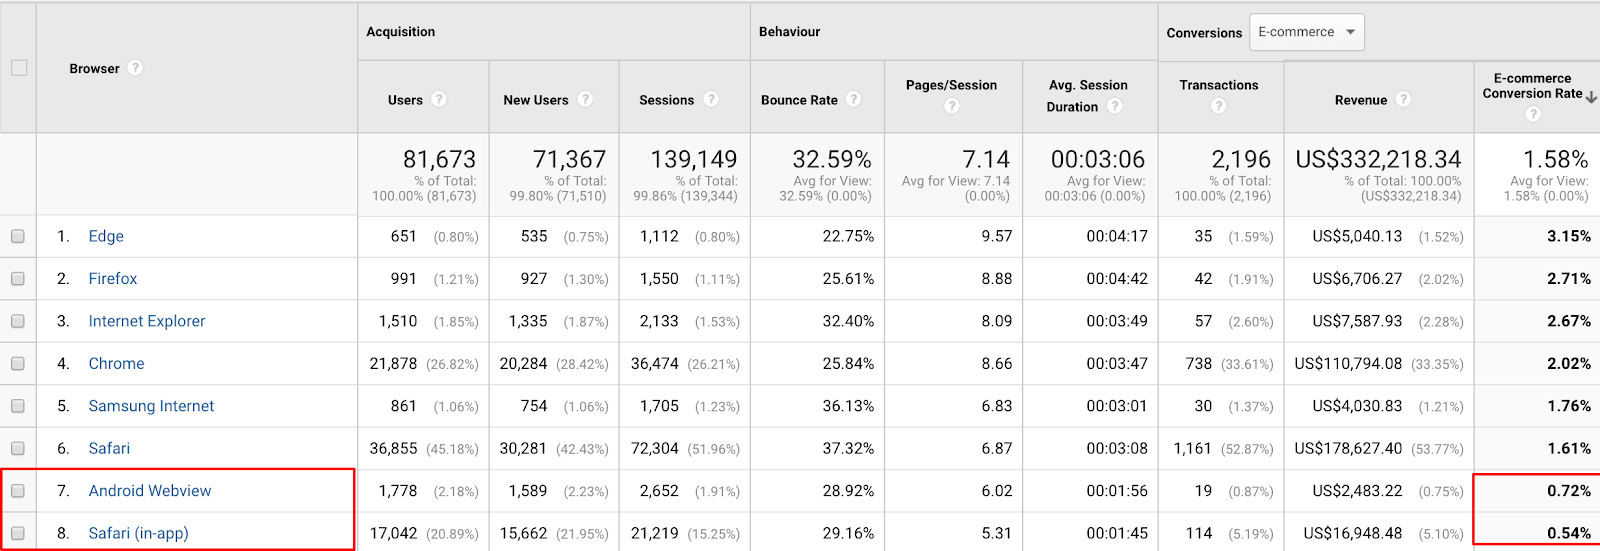
If there is one browser with a low conversion rate, then select the browser name and look at the version report to find the specific browser that is causing trouble.
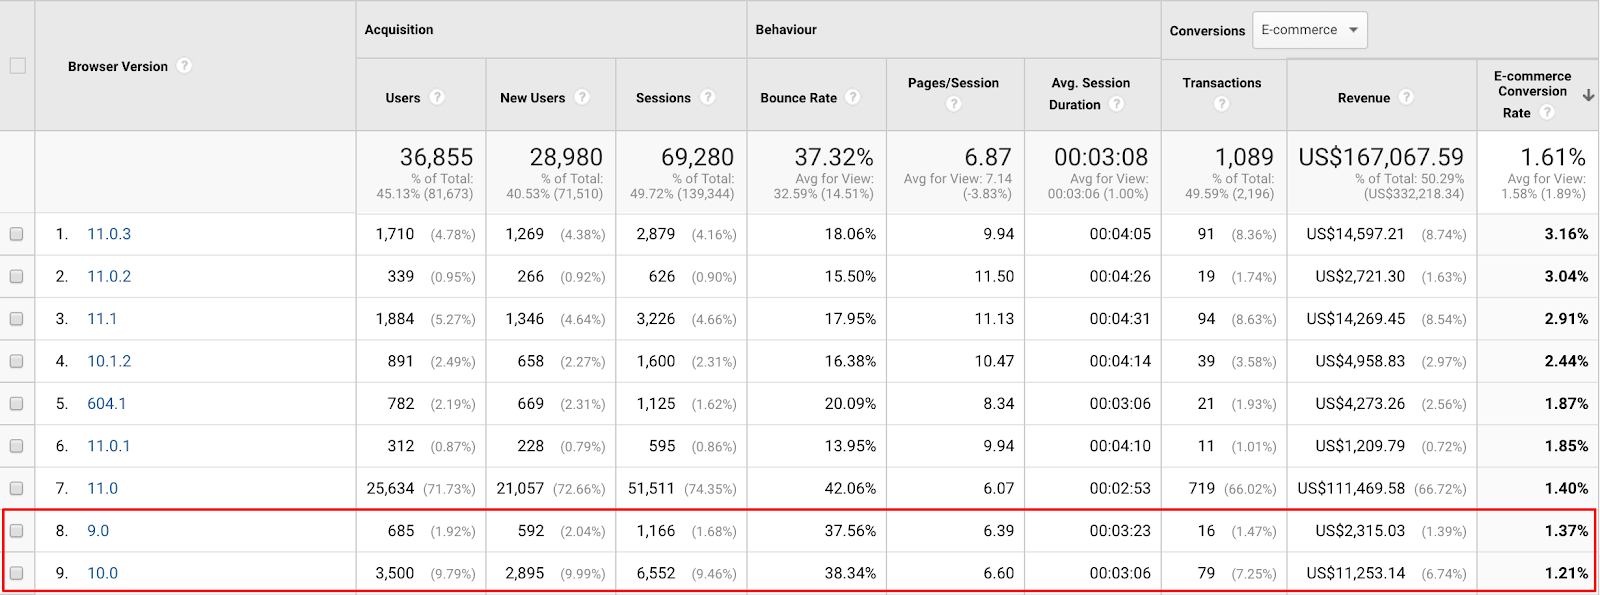
If the Safari browser versions 9.0 and 10.0 have low conversion rates, you can then do further usability testing with this setup.
For remote device and browser testing, use a tool like BrowserStack.[*]
You can also change the primary dimension to Screen Resolution, segment the data again. and look for similar patterns in low conversion rate circumstances.
This can give you insight into which devices are optimized well, like if mobile screen resolutions generally have low conversion rates then perhaps the responsive design or mobile user experience needs improving.
Click here to import the Browser Report into your Google Analytics.
Mobile (Device) Report
Similar to the previous report, you can use the Mobile report to understand which device types need further optimization and functionality testing.
Note: In this report under the advanced settings Exclude: Sessions; Less than: 1000.
Navigate to: Audience > Mobile > Overview.

You can also review conversion rates by device type as below:
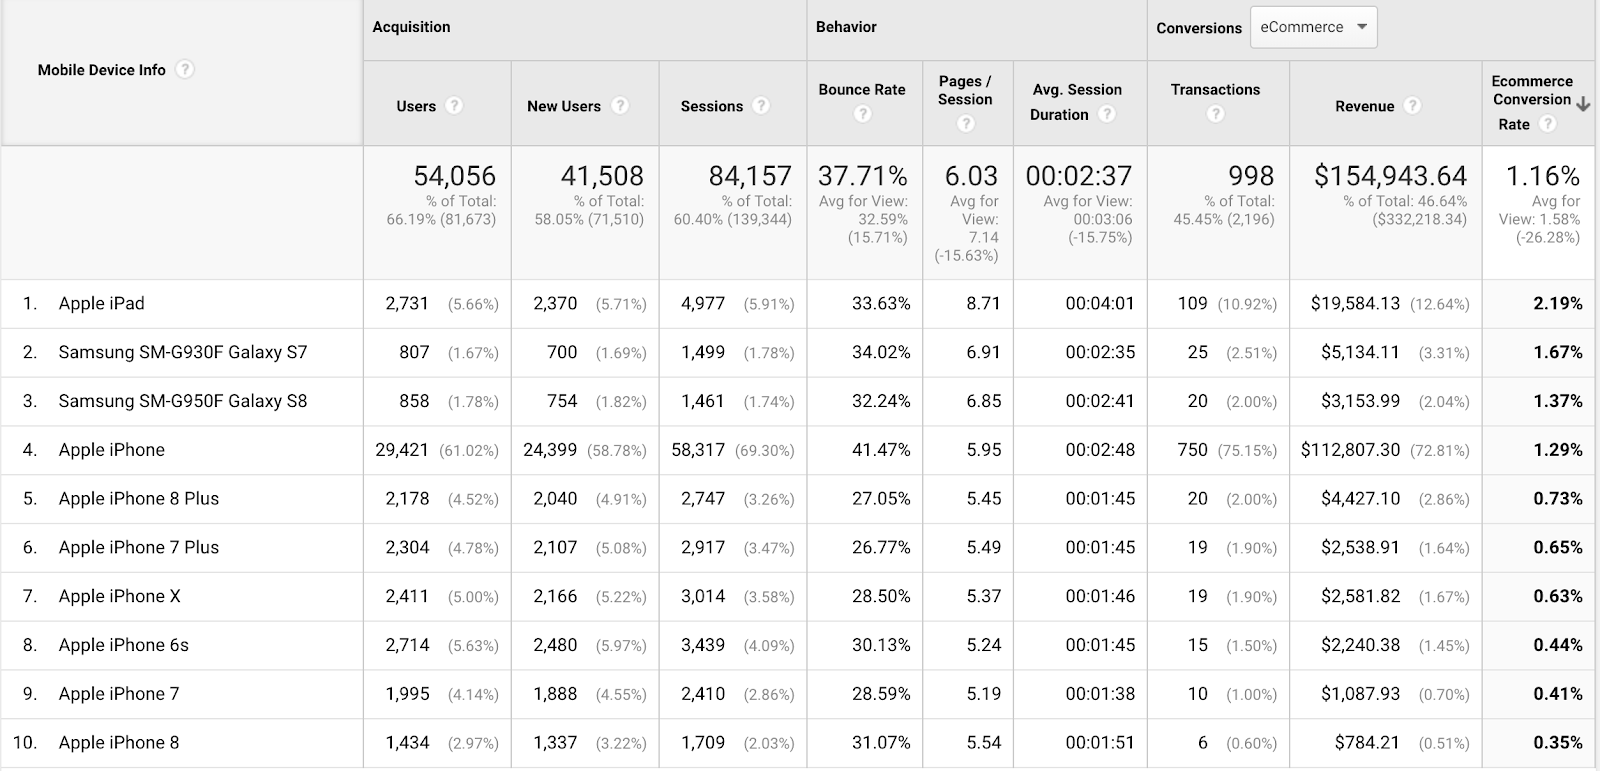
This will allow you to do device-level user testing and conversion optimization.
How To Use This Report
Find top device types by conversion rate
-
Find device types with a low conversion rate and optimize the user experience and ecommerce sales funnel on these devices.
Review devices by conversion rate
-
Perform user testing and CRO on devices with high traffic volumes and low conversion rates
Click here to import the Mobile (Device) report into your Google Analytics.
Channels Report
This report is perfect for understanding, on a basic level, which channels are driving the most revenue to your business.
Note: In this report under the advanced settings Exclude: Sessions; Less than: 1000.
Navigate to: Acquisition > All Traffic > Channels.
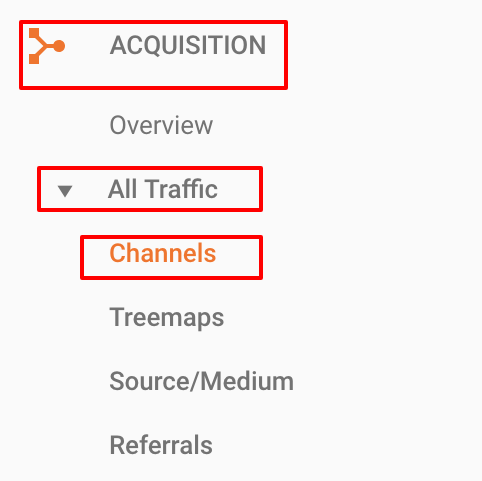
Order the results by conversion rate:

How To Use This Report
Find channels with the highest conversion rate
-
This is a very simple form of attribution analysis. You can learn which channels you should invest more in, dependent on conversion rate. But of course, you need to understand cost per acquisition for these channels to complete your calculation.
-
You can also learn which channels drive the most revenue to your business. Make sure you are investing in growing, and at least maintaining marketing share in these channels. They form your business's revenue foundation.
Click here to import the Channels Report into your Google Analytics.
Referrals Report
The Referrals report is a great way to learn which guest posting efforts, advertorial content or PR investments are generating the most revenue and highest conversion rates.
Note: In this report under the advanced setting Exclude: Sessions; Less than: 1000.
Navigate to: Acquisition > All Traffic > Referrals.
Then look at your referrals by transactions.

How To Use This Report
Find top referrers by revenue
-
Can you work with them more?
-
Are these paid placements? If so what is the ROI on marketing spend?
-
Are these placements or referral sales that benefit the business? Those coupons can create a lot of revenue but also reduce profit margins.
Find top referrers by conversion rate
-
Can you optimize these conversion rates with referrer specific landing pages?
-
Can you do more placements with them and drive more sales to the business? Or do business with them on other channels like Instagram.
Click here to import the Referrals report into your Google Analytics.
Site Speed Report
The Site Speed report is helpful in finding slow-loading pages and generally improving site speed, which is one of Google’s ranking factors for SEO.
Navigate to: Behavior > Site Speed > Page Timings.
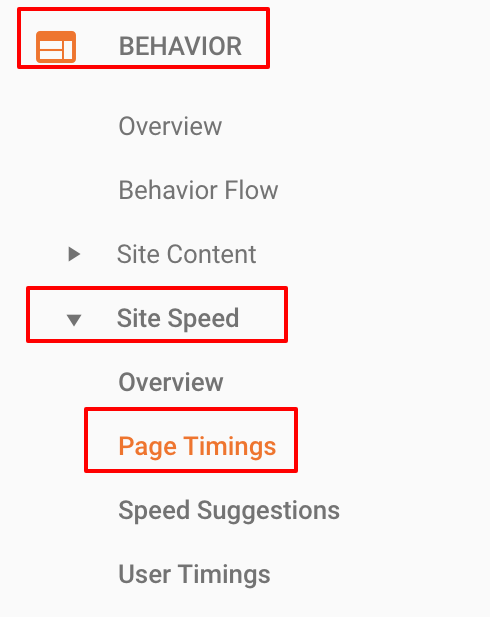
Remove URLs with parameters so you don’t see any duplicate URLs. You can do it by filling out the advanced menu like this:

Here is our report, in both columns we’ve selected Avg. Page Load Time (sec):
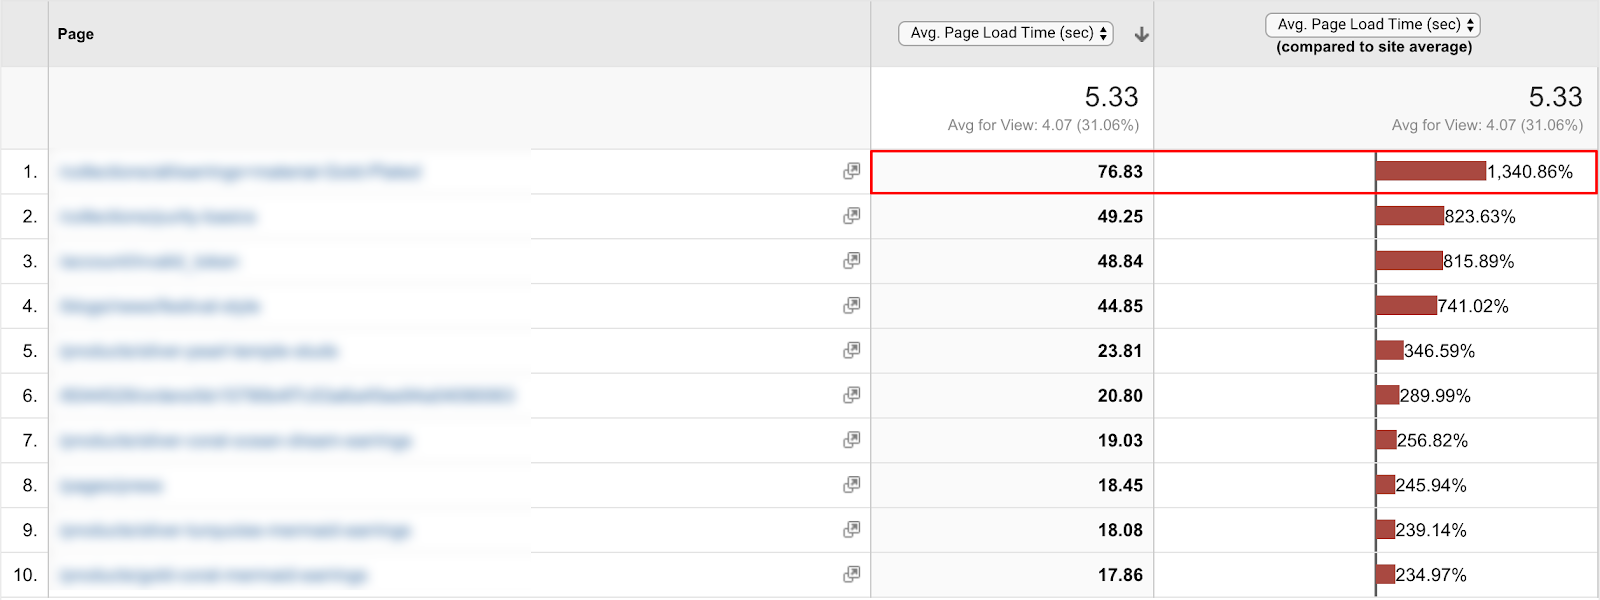
How To Use This Report
Find pages with the highest load times
-
Optimize these pages to improve your overall Google page speed score and rankings.
-
Find problem pages with technical errors or malware causing long page load times.
Note: You can’t share this in Google Analytics so please follow the steps above.
Search Terms Report
The search terms report is a great way to learn what people are searching for on your site. If you don’t have a search bar on your suite, you won’t see any data, so skip this report in that case.
Navigate to: Behavior > Site Search > Search Terms.
Here is our report:
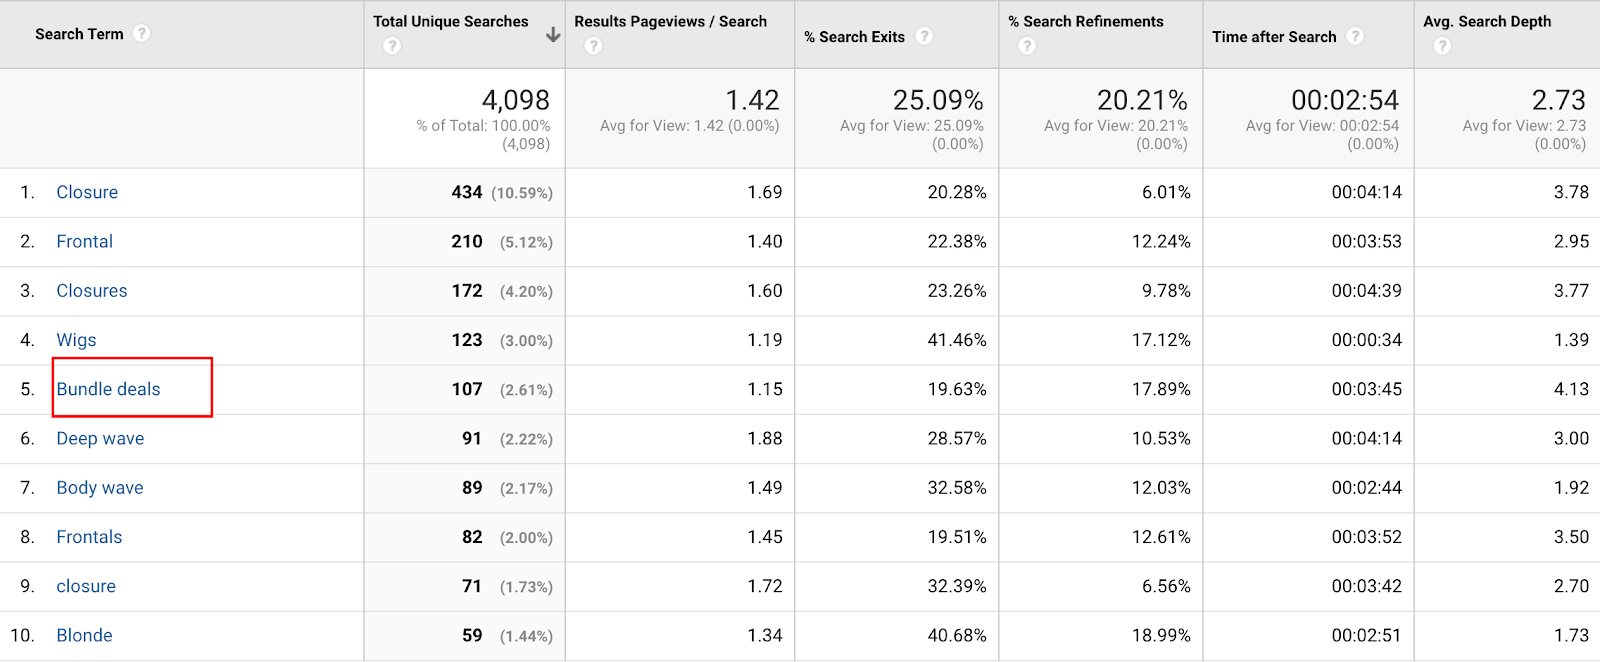
How To Use This Report
Find searches for products you don’t stock
-
This allows you to increase your product offering based on customer demand.
Find searches with non-product terms
-
Here you can see people are searching for ‘bundle deals’, you could then create a bundle offering in your store and test its success.
Click here to import the Search Terms report into your Google Analytics.
Ecommerce Report
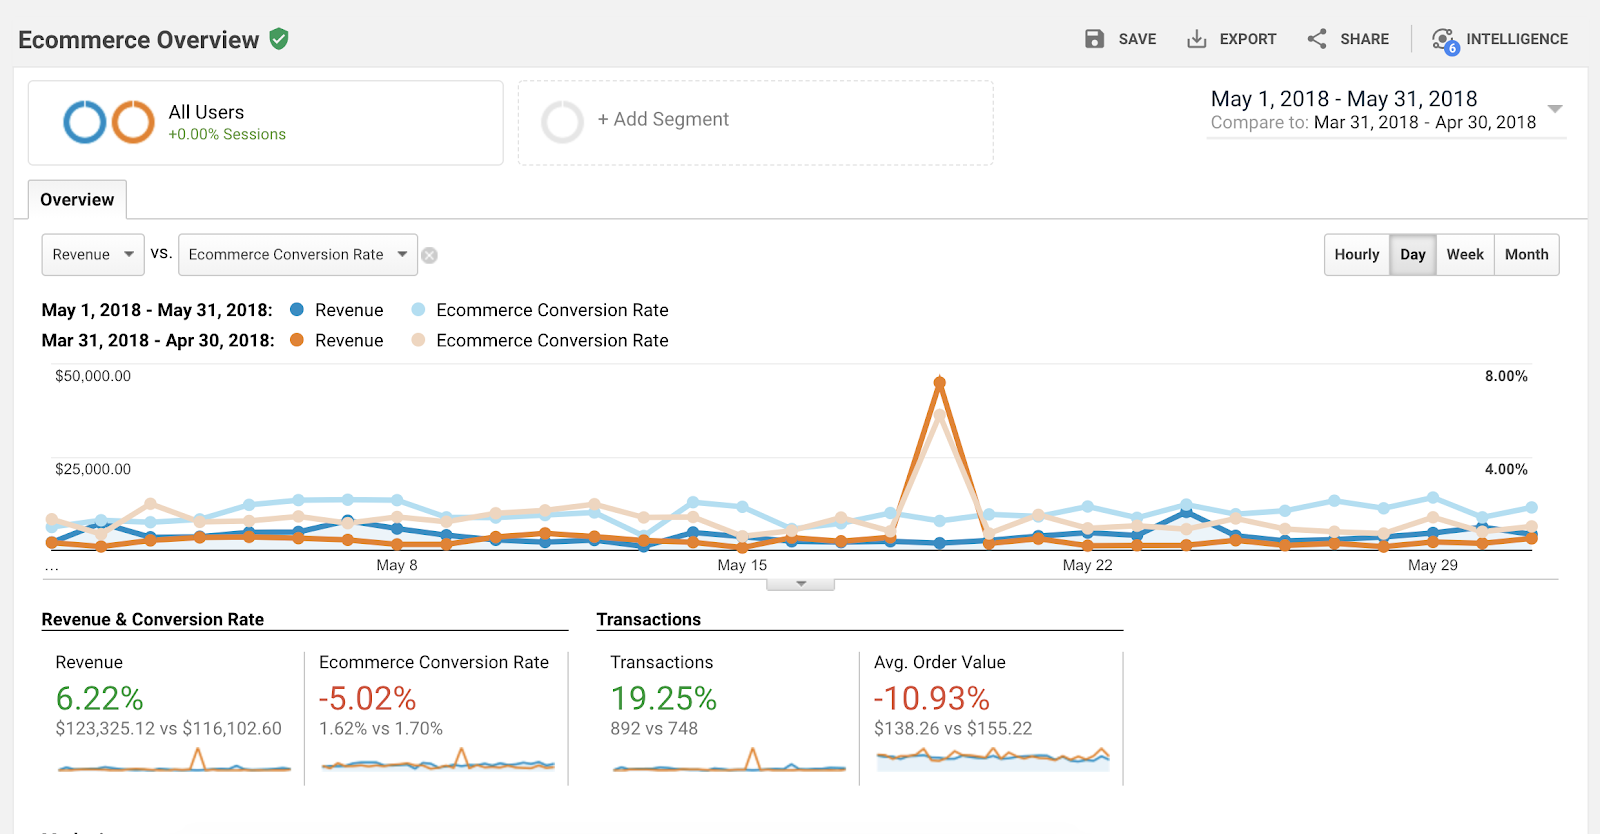
The ecommerce report is your main KPI dashboard. It’s a great way to see a snapshot of what is happening in the business in terms of revenue, conversion rates, transaction volume, and average order value month over month.
Navigate to: Conversion > Ecommerce > Overview.
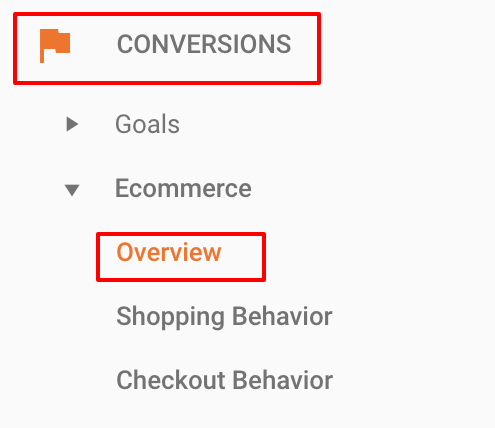
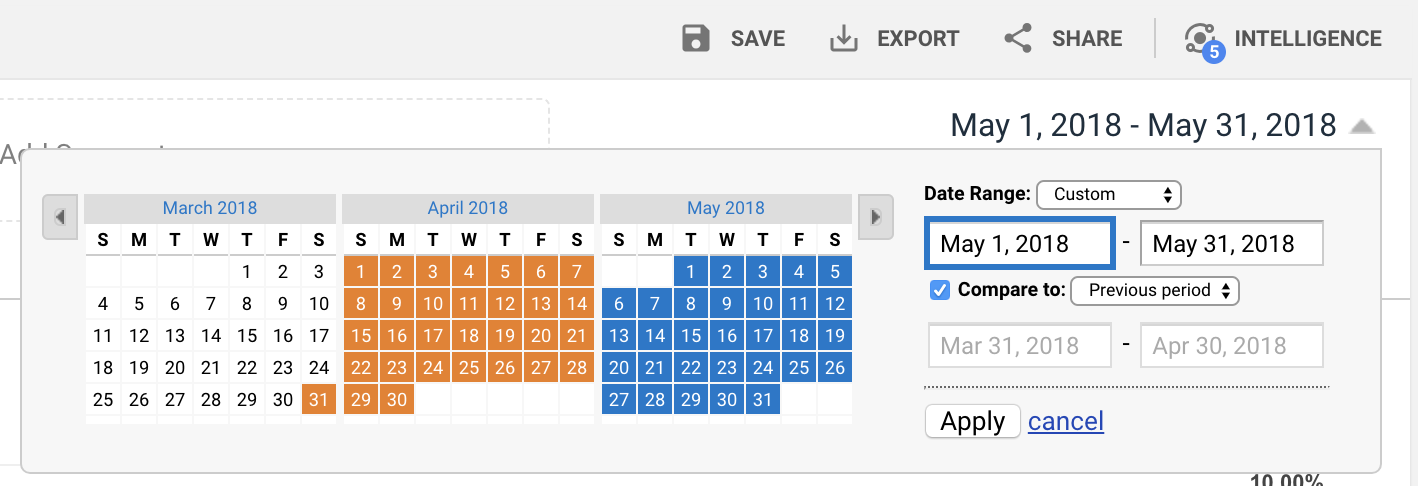
Select the last complete calendar month in the date picker, and compare it to the previous period.
Here is our report:
How To Use This Report
Find how your revenue is changing month over month
-
Better understand seasonality in your business, like back to school for kids clothing or summer spikes for swimwear companies.
-
Understand how marketing spend affects revenue month over month. To drill down into campaign specific data you should review the campaign report (Acquisition > Campaigns > All Campaigns).
-
Look to see if certain marketing activities create sales spikes; an affiliate sale can be seen here above with a large revenue spike.
Track your conversion rate change month over month
-
See how traffic quality and source affects conversion rates. To better understand conversion rates you need to study numbers for each traffic channel. Don’t just take the overall conversion rates changes per month as gospel. Maybe Facebook traffic conversion rate improved whilst Instagram traffic conversion rates got worse, dig deeper by looking at the Channels Report above.
Track transaction volume change month over month
-
See how your monthly transaction volume changes. You want to optimize for more conversions and therefore more transactions, but not at the price of getting lower average order values. Otherwise you may make paid customer acquisition unprofitable.
Look at your average order value change month over month
-
Can you increase AOV (average order value) with product bundling?
-
Can you increase AOV with cart upsells or recommended products?
Note: You can’t share this in Google Analytics so please follow the steps above.
What We Learned
To grow your ecommerce business, you must first understand what it looks like now, then you can create business objectives, goals, KPIs and targets to track and optimize.
In this post you learned about 10 Google Analytics reports you can use to inform changes in your business to test. You learned how to segment those reports, and how to make the data actionable.
The next step is taking action yourself.
Book a slot in your calendar for the next three months to review your data.
Want To See How To Find Your Revenue Per Email Using One Google Analytics Report?
For many ecommerce businesses, email is the primary driver of sales conversions. To help you see how much money you’re making from every email you send, we put together a free guide on how to find your revenue per email.
Click the button below to download the guide, plus a summary of all 10 ecommerce reports we covered in this blog post.
Add A Comment
VIEW THE COMMENTS