You can spend real money driving traffic to your website. You can run ads, publish content, post on social, obsess over your SEO. And still watch visitors leave without doing a thing.
That’s not a traffic problem. That’s a conversion problem.
Here’s the part that stings: most businesses respond to this by changing things based on gut feelings. New button color. Different headline. Someone in a meeting says “let’s try making it red” and suddenly, that’s the strategy. Nobody checks whether it worked. Then they wonder why their conversion rate won’t budge.
A/B testing is the obvious fix. And most people are doing it wrong.
Not because they’re bad at testing. Because they’re skipping the step that makes testing actually work: the framework. Random tests based on hunches produce random results. A structured A/B testing framework (one built on real research before a single test runs) is what separates businesses that are guessing from businesses that are compounding gains.
This post walks you through that framework, step by step.
What Is an A/B Testing Framework?
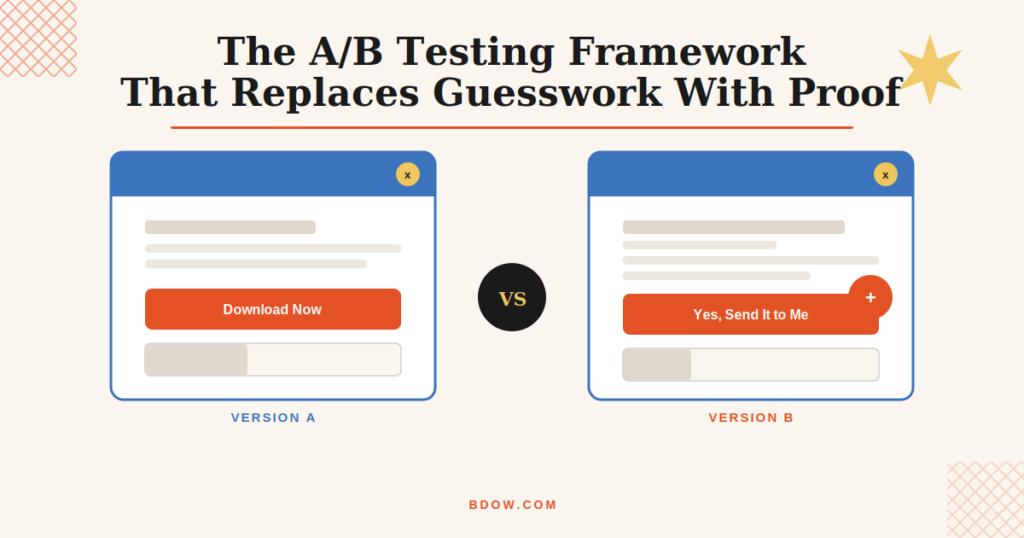
An A/B test (also called a split test) is simple: you show two versions of something to your visitors and measure which one converts better. Version A stays as-is. Version B gets a change. Equal traffic, equal time, and the data tells you what works.
An A/B testing framework is the process that surrounds the test itself: the research, the hypothesis, the prioritization, and the analysis. Without it, you’re just throwing things at the wall. With it, you’re running experiments that build on each other and move your conversion rate in a predictable direction.
The difference matters more than most people realize. Done right, testing compounds: each experiment builds on the last instead of resetting to zero. Done casually, it mostly produces noise. In an analysis of more than 28,000 experiments, the testing platform Convert found that only 20% ever reached statistical significance, usually because they were stopped too early or never set up properly in the first place
The framework solves that.
Step 1: Start With a Goal, Not a Guess
Before you touch a single element on your site, you need to know what you’re actually optimizing for.
This sounds obvious. It isn’t. Most people start with “I want to test my homepage” instead of “I want to increase email sign-ups from my homepage by 15%.” The first is a direction. The second is a testable goal.
Pick one conversion event as your North Star before anything else:
- Email list sign-ups
- Free trial starts
- Product purchases
- Demo requests
- Any other action you want more of
Once you know what you’re measuring, every piece of research that follows has a filter. You’re not looking at data in general. You’re looking for data that explains why people aren’t doing the one thing you want them to do.
A useful exercise: ask yourself questions that point toward that goal. Who is this page for? What do they need to feel confident enough to act? What’s stopping them right now? What would make the decision easier?
When you start with the right questions, the data you collect becomes useful instead of overwhelming.
Step 2: Audit What You Already Have
Most sites have obvious problems that nobody has looked at in months. This step is about finding them before you start testing around them.
Heuristic Analysis: The Expert Walkthrough
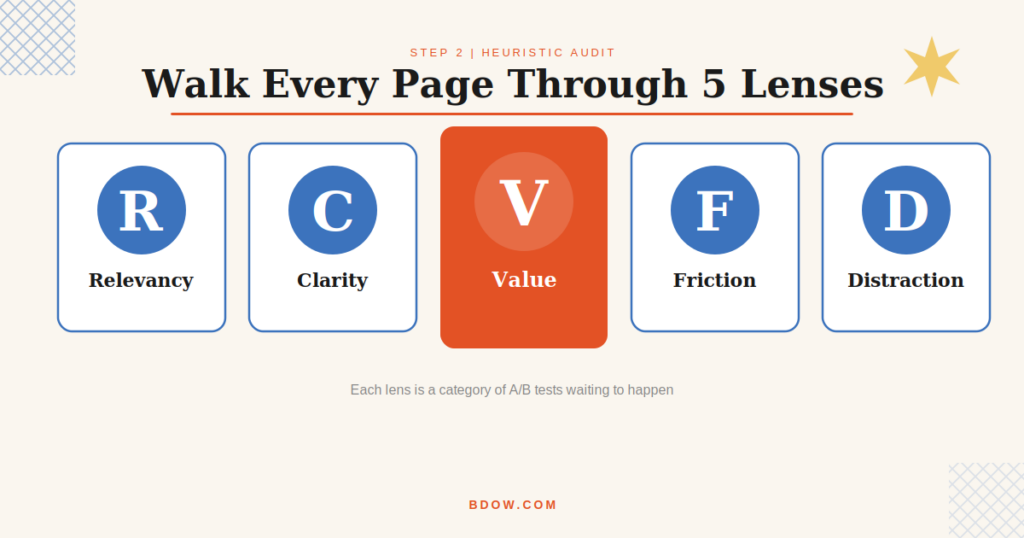
Walk through your key pages the way a conversion-focused stranger would. No insider knowledge, no familiarity bias. Just look at each page through five lenses:
- Relevancy: Does this page match what the visitor expected when they clicked?
- Clarity: Is the offer immediately clear, or does someone have to work for it?
- Value: Does the page communicate why this matters to them?
- Friction: What’s creating doubt, hesitation, or confusion?
- Distraction: What’s on the page that isn’t helping the visitor take action?
Write down everything that looks like a problem. These aren’t confirmed issues yet. They’re areas of interest to investigate with data. The goal is to walk in thinking “opportunity,” not “verdict.”
Each flag you write down is a potential A/B test waiting for evidence to back it up. A page that scores low on clarity? That’s a headline test. Low on value? That’s an offer test. High on distraction? That’s a layout test.
Technical Analysis: The Stuff Nobody Checks
You might have the most persuasive page in the world. If it doesn’t render properly on the browser or device your visitor is using, it doesn’t matter. They’re gone.
Pull up your analytics and look at conversion rates by browser and device. If one browser is converting at 9% while another is hovering near zero, that’s not a mystery. That’s a technical problem disguised as a conversion problem. Fix it before you test anything on that page.
While you’re in there, check your page speed. The metric that actually matters isn’t total load time. It’s time to interactive, meaning how long until a visitor can actually use the page. Sites loading in one second convert at roughly 3x the rate of sites that take five seconds. (Portent) If your slowest pages are also your most visited, that’s low-hanging fruit worth grabbing before anything else.
Technical fixes aren’t A/B tests. They’re prerequisites. You can’t get clean test data from a page that’s broken for 20% of your visitors.
Step 3: Let Your Analytics Tell You Where People Drop Off
Google Analytics (or whatever analytics platform you’re using) is your best diagnostic tool. The problem is that most setups are broken in ways that go unnoticed: goals not configured, key events not tracked, data that looks complete but isn’t trustworthy.
Before you analyze anything, do a quick health check:
- Are your goal conversions firing correctly?
- Is there any obvious data missing from key pages?
- Are sessions being tracked across your funnel, or are there gaps?
Once you trust your data, start asking it real questions. Where are visitors dropping out of your funnel? Which pages have the highest traffic but the lowest conversion rates? Which entry pages lead to purchases, and which ones lead to bounces?
Analytics can tell you the what and the where. It can show you that 70% of visitors leave your pricing page without clicking anything. It can’t tell you why. That’s what the next two steps are for.
But that drop-off point? That’s exactly where you’ll want to run your first test once you understand the reason behind it.
Step 4: Ask Your Visitors What They’re Thinking
Qualitative research is the part most people skip because it feels slow. It isn’t. It’s the fastest way to surface the real objections, confusions, and hesitations that your data can’t explain.
On-Page and Exit Surveys
A short, targeted survey on a high-dropout page can reveal more than weeks of analytics review. Two questions that tend to produce useful answers:
- “Is there anything preventing you from signing up right now?”
- “Is there information you were looking for on this page that you couldn’t find?”
You can show these as on-page surveys (timed to appear after a visitor has been on the page long enough to have an opinion) or as exit surveys triggered when someone is about to leave. Exit intent technology is particularly useful here, because catching visitors at the moment of departure tends to produce honest answers.
Keep questions open-ended. Yes/no questions tell you almost nothing. You want to hear people explain things in their own words, because the language they use is often the same language that will work in your copy.
Email Surveys for Existing Customers
If you want to understand why people buy, ask the people who already did. Recent first-time customers (not repeat buyers, who will skew your results) are a goldmine. Aim for around 200 responses, because after that the answers tend to repeat themselves.
Design every question backward from what you want to learn. What made them choose you over an alternative? What almost stopped them? What would have made the decision easier? Those answers are test hypotheses waiting to happen.
If five customers say they weren’t sure the product would work for their industry, that’s not just feedback. That’s a brief for a social proof test on your signup page.
Step 5: Watch What People Actually Do
What people say they do and what they actually do are often different things. Mouse tracking and session recording tools close that gap.
Heatmaps and Click Maps
Click maps show you where visitors are actually clicking, and sometimes you’ll find they’re clicking on things that aren’t links. An image, a sentence, a decorative element that looks interactive. If visitors keep clicking on something, either make it a link or change how it looks. Both are easy wins.
Heatmaps show attention patterns across the page. Be skeptical of hover-based heat maps specifically. They’re less accurate than they look. Click and scroll data tends to be more reliable.
Scroll Maps
Scroll maps show you exactly how far down your visitors make it before they leave. This is especially valuable on long sales pages, landing pages, and lead magnet offer pages. If your most important content sits below the point where 60% of visitors have already checked out, you’ve found a real problem, and probably a strong test idea.
Session Recordings
Watch recordings of real visitors moving through a page where a lot of people drop off. You’ll see things in five minutes of video that would take weeks to surface through analytics alone: the form field that makes people pause, the navigation element that pulls them away from the page, the moment where things clearly go wrong.
Every one of those moments is a test idea with a clear before and after.
Form Analytics
If you have opt-in forms, checkout forms, or any multi-field form on your site, form analytics are worth turning on. These tools identify which fields produce hesitation, which ones generate error messages, and where people abandon the form entirely. HubSpot’s analysis of more than 40,000 landing pages found a clear pattern: the more fields a form has, the lower it converts. In their data, dropping from four fields to three lifted conversions by close to 50%. The catch is you need form analytics to know which fields are actually costing you.
Step 6: Run User Testing
User testing is watching real people attempt to use your site while they narrate what they’re thinking. It’s uncomfortable (in the most useful way possible) because you’ll watch people miss things you thought were obvious.
The quality of a user test depends entirely on the quality of the tasks you give people. A good session usually includes three types:
- A specific task: “Find a pop-up template for an e-commerce discount offer.”
- A broad task: “Find something on this site you’d be interested in.”
- Funnel completion: “Sign up for a free account.”
You don’t need dozens of participants. Research consistently shows that five to eight users will surface the majority of usability issues on any given page. (Nielsen Norman Group) Watch for where people pause, backtrack, or express confusion. Those moments are your highest-priority test candidates.
The thing they couldn’t find? Test making it more prominent. The step where they hesitated? Test rewriting the copy around it. User testing hands you the test brief. You just have to listen.
How to Prioritize Your Tests

After going through these six research steps, you’ll have more ideas than you can test at once. That’s a good problem. Now you need to sort them.
Start by dropping every issue into one of five buckets:
- Test: Clear opportunity to change behavior and improve conversions. Run an experiment.
- Just Do It: So obvious it doesn’t need a test. Fix it now.
- Instrument: Needs a technical fix first (broken tracking, missing events, analytics gaps).
- Hypothesize: You know there’s a problem but don’t have a clear solution yet. Brainstorm before testing.
- Investigate: Needs more data or research before you can act on it.
Then score each item using the PIE framework:
- Potential: How much could fixing this move the needle?
- Importance: How much traffic or revenue does this affect?
- Ease: How difficult is it to implement and test?
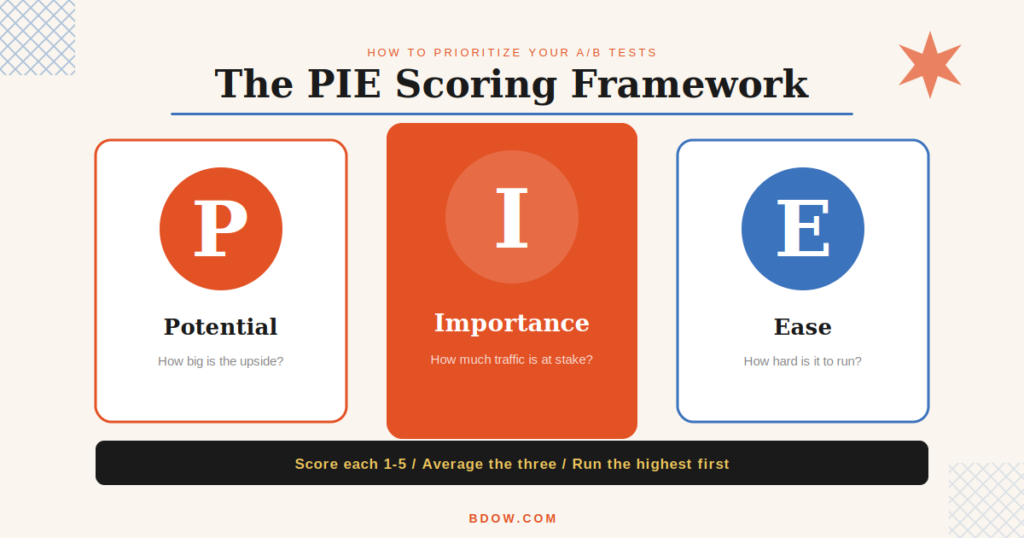
Score each one 1 to 5, average the three scores, and work down the list from highest to lowest. The math isn’t magic. It’s just a way to make prioritization visible and debatable instead of political.
Build this into a spreadsheet. Update it every time a test finishes. Over time, it becomes the source of truth for your entire optimization program.
How to Write a Hypothesis That Actually Holds Up
Every test needs a hypothesis before it runs. Not “let’s try a different headline.” An actual statement of what you expect to happen and why.
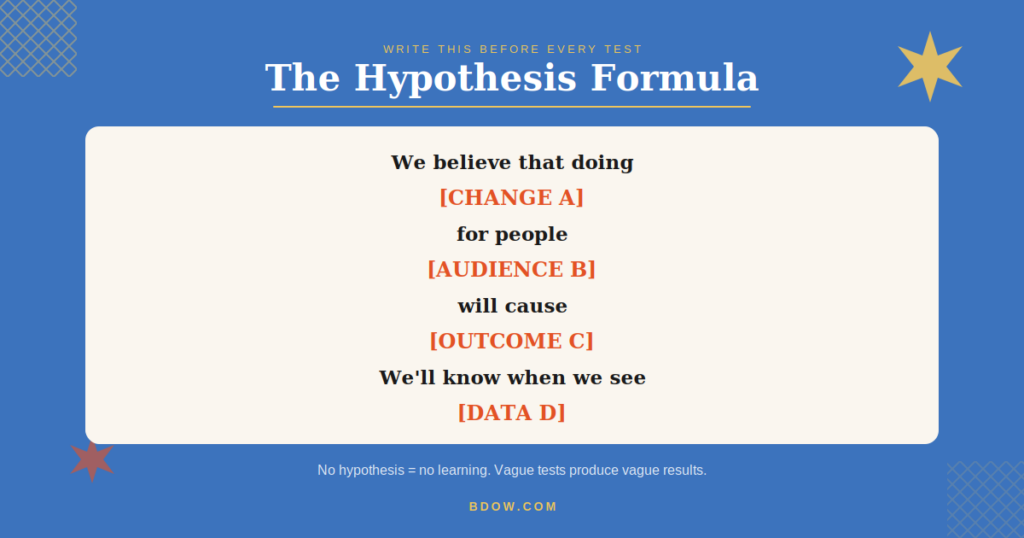
A formula that works:
“We believe that doing [A] for people [B] will make [outcome C] happen. We’ll know this when we see [data D].”
For example: “We believe that adding a testimonial from a small business owner above our opt-in form will increase sign-ups from first-time visitors, because it removes doubt about whether BDOW! works for businesses like theirs. We’ll know this when we see a statistically significant lift in form submissions from new visitors.”
That’s a testable hypothesis. It names the change, the audience, the expected outcome, and the success metric. When the test ends, you know exactly whether it worked, and why. Vague tests produce vague learnings. Sharp hypotheses compound.
Where to Start A/B Testing Right Now
If this framework feels like a lot of setup before you run your first test, here’s the shortcut: start with your opt-in forms and popups.
They’re the easiest elements to test without development resources. They produce fast results because they’re high-interaction. And the variables are clean (headline, offer, button copy, timing, design), which means you get clear signals instead of murky ones.
Things worth testing on a popup or opt-in form:
- Headline copy: Does leading with a benefit outperform a question? Does specificity beat vague promises? (Hint: power words and trigger words move the needle here.)
- The offer itself: A checklist vs. a guide. A discount vs. free shipping. A specific promise vs. a general one. If you need ideas, here’s a full breakdown of lead magnet types that convert.
- Button copy: “Get the guide” vs. “Send it to me” vs. “Download now.”
- Timing and trigger: Does an exit intent popup outperform a timed popup for your audience?
- Form length: One field (email only) vs. two (name + email). The answer is almost always fewer fields, but test it for your specific audience.
BDOW! has A/B testing built directly into the platform, so you can run popup and form tests without touching your site’s code or installing separate software. If you haven’t tried it yet, it’s worth starting there.
Stop Guessing. Start Compounding.
Here’s what the research phase gives you that a list of “100 things to A/B test” never will: specificity. You’re not testing random ideas. You’re testing the actual problems your actual visitors have on your actual site.
That’s the difference between a test that moves your conversion rate and one that produces a shrug and a “we’ll try something else next month.”
The framework isn’t complicated. It’s just disciplined:
- Set a clear conversion goal before you look at anything.
- Walk your site like a skeptical stranger and flag what doesn’t hold up.
- Check that your site works technically: speed, browser rendering, mobile.
- Audit your analytics and find where people are dropping off.
- Survey your visitors to find out why.
- Watch session recordings and click maps to see what they actually do.
- Run user tests to catch what everything else missed.
- Prioritize your findings with PIE scoring and run your tests in order.
- Write a hypothesis before every test. Measure against it when it ends.
Do this once and you’ll have more good test ideas than you can run in a quarter. Do it as a regular practice and you’ll have a conversion rate that compounds, quietly, consistently, and without spending another dollar on traffic.
Ready to run your first test? Create a free BDOW! account and set up your first A/B test in under 10 minutes.


Add A Comment
VIEW THE COMMENTS