Pop-ups are annoying. You’ve heard it. You’ve probably said it.
And yet the data keeps saying the same thing: they work. In 2026, the average website pop-up converts somewhere between 3.5% and 5% of visitors who see it. The top 10% of campaigns push past 50%. For comparison, the average ecommerce site converts 1.5% to 2.5% of its total traffic. Which means a mediocre pop-up is still outperforming the rest of your site.
We’ve been knee-deep in pop-up data since 2016, when Sumo (now BDOW!) analyzed 1.75 billion pop-ups to figure out what made the good ones good. A decade later, the platforms have changed, the privacy rules have tightened, and AI has entered the chat. The fundamentals? Mostly the same. The benchmarks? Way different.
What’s changed most is the gap between bad pop-ups and good ones. In 2016, the top 10% of pop-ups averaged around 9% conversion. In 2026, the top 10% routinely clear 50%. The ceiling has gotten much higher because the tools have gotten much smarter: behavioral triggers, mobile-first design, AI personalization, and built-in A/B testing have raised the floor for anyone willing to use them.
The pop-ups losing in 2026 are the ones still using 2016 tactics: instant page-load fires, generic newsletter asks, no mobile design thought. The pop-ups winning are the ones designed around context, intent, and timing.
Here’s what the 2026 data actually says about pop-ups, what counts as a good conversion rate, and how to build the kind of pop-up that doesn’t make people roll their eyes.
Table of Contents
Are Pop-ups Dead?
No. Next question.
Okay, longer answer: the “pop-ups are annoying” line is a feeling, not a fact. People say they hate pop-ups and then sign up for the newsletter anyway. Marketers learned a long time ago that what people say and what people do are two different sports.
The data backs it up. Across the big 2025–2026 benchmark studies (Wisepops, Pop-upsmart, OptiMonk, Omnisend), pop-up conversion rates are climbing, not falling. Wisepops’ 2026 report based on 1 billion displays shows an average conversion rate of 4.82%, up from 4.65% the year before. Pop-upsmart’s 10,000-campaign study lands at 3.49%. OptiMonk reports 11.09% across their dataset.
The numbers vary because the audiences vary. But all of them tell the same story: pop-ups still convert, and they convert at multiples of what the average website does on its own. Used badly, a pop-up is a nuisance. Used well, it’s the highest-converting square inch of real estate on your site.
The real question isn’t do pop-ups work. It’s what makes them work. That’s what the rest of this post is about.
What’s a Good Pop-up Conversion Rate in 2026?
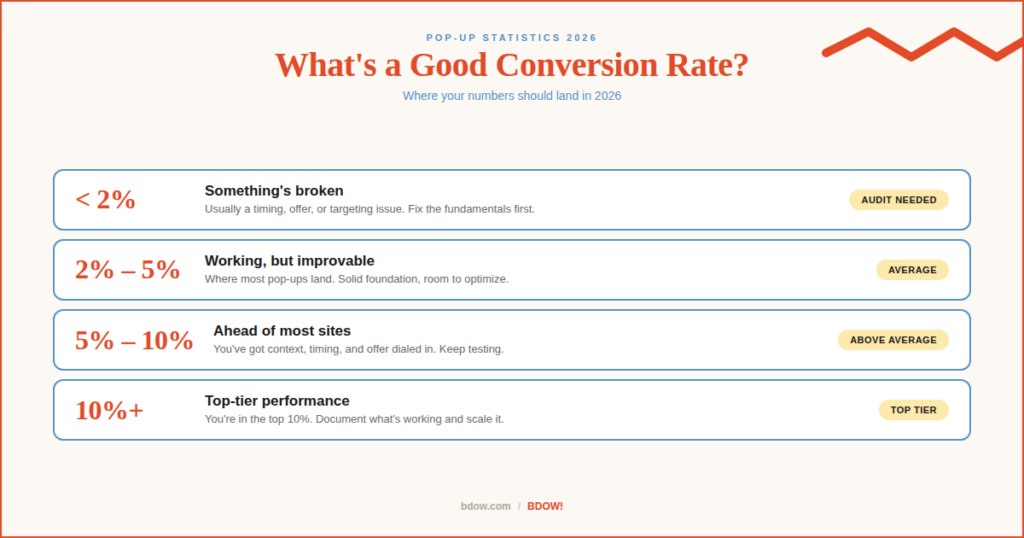
Here’s the quick benchmark for the average pop-up, regardless of type or industry:
- Below 2%: Something structural is broken. Usually timing, offer, or targeting.
- 2% to 5%: Working, but improvable. Most pop-ups land here.
- 5% to 10%: Ahead of most sites. You’ve got the fundamentals right.
- 10%+: Top-tier. You’re doing something other people should copy.
The wide range across studies (Wisepops 4.82%, Pop-upsmart 3.49%, OptiMonk 11.09%) isn’t a contradiction. It’s a methodology difference. Some studies count every display, some count only pop-ups that received engagement, some skew toward ecommerce, others toward content sites. A 3.5% average and an 11% average can both be true depending on what you’re measuring.
The takeaway: don’t benchmark against a single industry-wide number. Benchmark against your own previous results, your specific pop-up type, and your industry.
What the top 10% of pop-ups look like
The most useful benchmark isn’t the average. It’s the top 10%, because it tells you what’s possible.
Wisepops’ 2026 data shows the top 10% of campaigns converting at 57.7%. OptiMonk’s top 10% averages 42.35%. Pop-upsmart’s top performers regularly clear 20%. These aren’t accidents. They’re pop-ups that got context, timing, offer, and design right at the same time.
In other words: a 50%+ conversion rate isn’t a unicorn. It’s what happens when you stop treating pop-ups like an afterthought.
Pop-up Conversion Rates by Industry
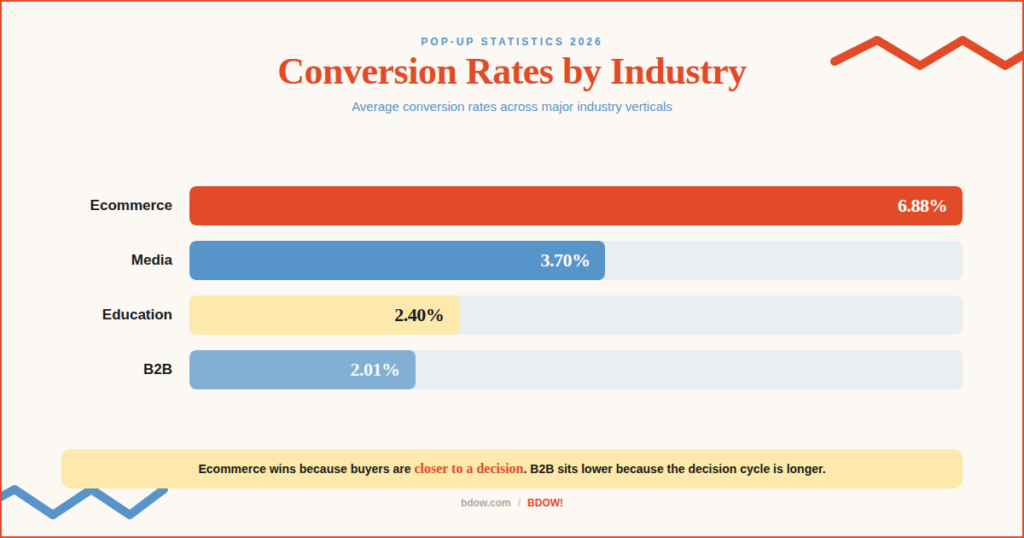
Different industries see different baselines. A 3% conversion rate is excellent in some categories and concerning in others. Wisepops’ 2026 industry breakdown:
- Ecommerce: 6.88% (highest)
- Media: 3.70%
- Education: 2.40%
- B2B: 2.01% (lowest)
Ecommerce wins because the visitor is closer to buying. They came to shop. A 10% discount pop-up intersects an intent that’s already there. B2B sits at the bottom because the decision cycle is longer, the offers (whitepapers, demos, free trials) take more trust to accept, and the buyer is rarely solo.
What this means for setting your own expectations:
- If you sell physical products, target 5% to 7% as your baseline.
- If you publish content, target 3% to 5%.
- If you sell B2B SaaS or services, target 2% to 4% and be happy at 3%.
- If you’re in food and beverage, beauty, or other high-repurchase categories, you can push toward 8%+ with the right offer.
Hitting “average” in your own industry is a real win. Hitting double the industry average is what separates pros from people who slapped a newsletter signup on the homepage and hoped.
One more thing to flag: the industry benchmark is the floor, not the ceiling. A B2B service business hitting 2% on a generic “subscribe” pop-up is doing fine for the benchmark, but they’re leaving most of the available conversion on the table. The same B2B business running a targeted lead magnet pop-up on a high-intent pricing page can easily hit 8% or 10%. Industry averages tell you what’s normal. They don’t tell you what’s possible.
Mobile vs. Desktop Pop-up Performance
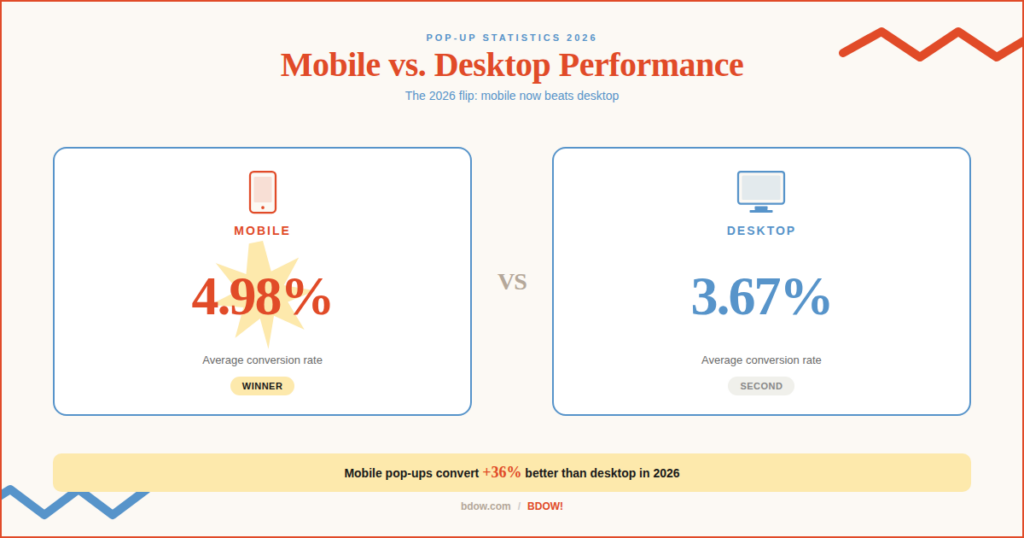
Here’s a stat that surprises people: in 2026, mobile pop-ups outperform desktop pop-ups.
Wisepops’ 2026 data shows mobile pop-ups converting at 4.98% versus desktop at 3.67%. That’s a 36% lift on mobile. Other studies (Gill Andrews, OptiMonk) report even bigger gaps, with mobile converting up to 74% better than desktop.
Why? Three reasons:
- Full viewport attention. A pop-up on a phone takes up most of the screen. There’s no scrolling around it, no glancing at another tab. It demands a decision.
- Simpler design. Mobile pop-ups have to be tight. That forced constraint usually makes the offer clearer.
- Pattern interruption. Mobile users scroll fast. A well-timed pop-up creates a pause moment that desktop users get fewer of.
The catch: Google penalizes intrusive mobile interstitials in search rankings. A pop-up that covers the entire mobile screen at page load can hurt your SEO. The fix is to use smaller bottom-bar pop-ups on mobile, or trigger pop-ups after the user has engaged (scroll, time on page, exit intent) rather than immediately on load.
If your pop-up strategy was designed for desktop and you’re treating mobile as an afterthought, you’re leaving the better-converting half of your traffic on the table.
6 Elements That Make (or Break) Pop-up Conversion
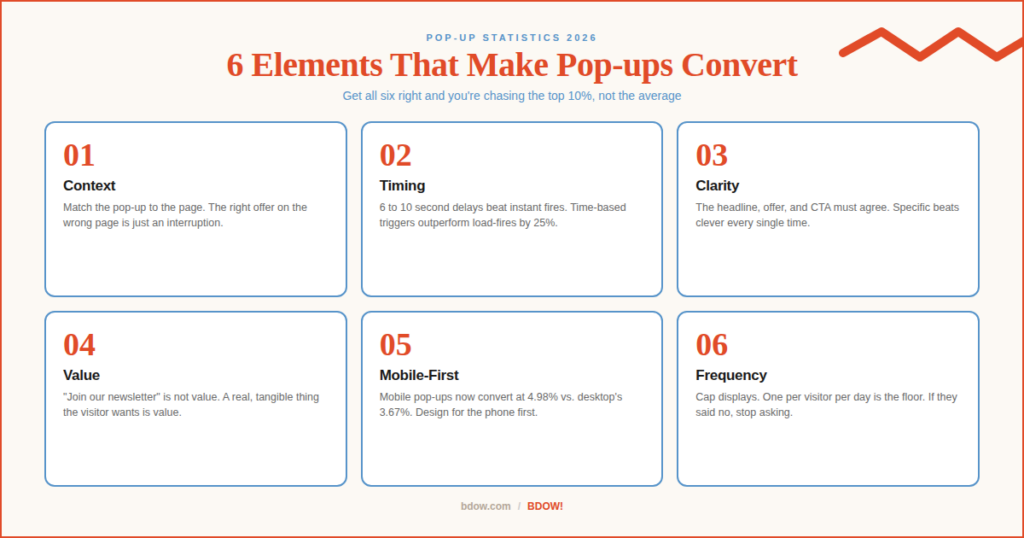
Across every major pop-up study, the same handful of variables keep separating the winners from the rest. After looking at the data, here are the six that matter most.
1. Context: the right pop-up on the right page
Context is what your pop-up is surrounded by. It’s the page content, the visitor’s intent, and the place they are in their journey. A great offer in the wrong context is just an interruption.
A high-converting pop-up builds on the page it appears on. Think of it as a continuation, not a separate event.
- Blog post: Offer a content upgrade or newsletter related to the post topic.
- Product page: Offer a discount, free shipping, or a bundle.
- Pricing page: Offer a comparison guide, demo, or limited-time offer.
- Checkout: Offer a cart-save discount when the visitor tries to leave.
- Specialized resource page: Offer the lead magnet that goes deeper on what they just read.
If the same pop-up runs across your entire site, it’s set up to fail on most of it. Build pop-ups for specific pages, not for the homepage and hope.
2. Timing: don’t ambush, don’t wait too long
Immediate pop-ups are the most common pop-up mistake on the internet. The visitor hasn’t read a word yet and you’re already asking them to subscribe. The conversion rate reflects it.
The 2026 data on timing is clear:
- 6 to 10 second delay performs best for time-based triggers
- Scroll-triggered pop-ups (typically firing at 30% to 50% scroll depth) convert around 5.3% on average
- Time-on-page triggers outperform immediate triggers by roughly 25%
- Click-triggered pop-ups convert at the highest rate of any trigger, around 22%
The right timing depends on the page. A 500-word blog post needs a faster trigger than a 5,000-word guide. The simplest way to find your timing: check the average time on page in Google Analytics, then set your pop-up to fire at about 30% to 50% of that.
3. Clarity: the offer and CTA have to agree
If your headline promises “tips and updates” and your button says “Subscribe,” you’ve already lost half your conversions. Vagueness is a killer.
Compare:
- Fuzzy: “Sign up for our newsletter to get tips and updates”
- Clear: “Get the free 10-step checklist (delivered today)”
The clear version answers the three questions every visitor is asking: What do I get? When do I get it? What do I do to get it?
Your CTA has to match the offer, too. If the pop-up offers an ebook, the button should say “Get the Ebook,” not “Submit.” Friction comes from any moment of hesitation, and a mismatched CTA forces hesitation. (For more on this, see our guide to headline formulas and the post on power words that actually move people.)
4. Value: what you’re actually offering
Pop-ups don’t have inherent value. The offer does. Your pop-up either reflects the value of the page (contextual value) or delivers a piece of value that only the pop-up can provide (inherent value).
Contextual value is when the page does the selling and the pop-up closes the loop. Someone reads a great article on email marketing, and the pop-up offers more articles like it. The reader is already sold on the topic.
Inherent value is when the pop-up carries the offer itself. A free template, an exclusive discount, an early-access guide. The visitor doesn’t need to be deep into your content to want it.
The mistake most pop-ups make is asking for an email in exchange for nothing specific. “Join our newsletter” is not value. “Get the 47-page wedding pricing guide” is. Specificity sells.
5. Mobile-first design
We covered the numbers above, but it’s worth saying again: design for mobile first, then adapt for desktop. The opposite approach (designing for desktop and hoping mobile works) is how you end up with a pop-up that covers the close button on iPhones or buries the CTA below the fold.
Rules of thumb for mobile pop-up design:
- Keep total fields to one or two (email plus first name max)
- Make the close button at least 44px by 44px (Apple’s recommended tap target)
- Don’t fire on page load (Google penalty risk)
- Test on actual devices, not just a browser resize
6. Frequency: respect the no
A pop-up that hits the same visitor on every page is a pop-up that’s training your visitors to hate your site. The data on visitor tolerance has stayed consistent across every pop-up study: showing the same pop-up more than once per session tanks long-term engagement, even if it sometimes nudges a one-time conversion.
A one-day minimum frequency cap is the standard for most sites. If you’re high-traffic or running multiple campaigns, two to three days is safer.
The same goes for visitors who already subscribed or clicked. If they said yes once, stop asking. Modern pop-up tools (BDOW! included) make this an easy toggle. Use it.
The Highest-Converting Pop-up Types in 2026
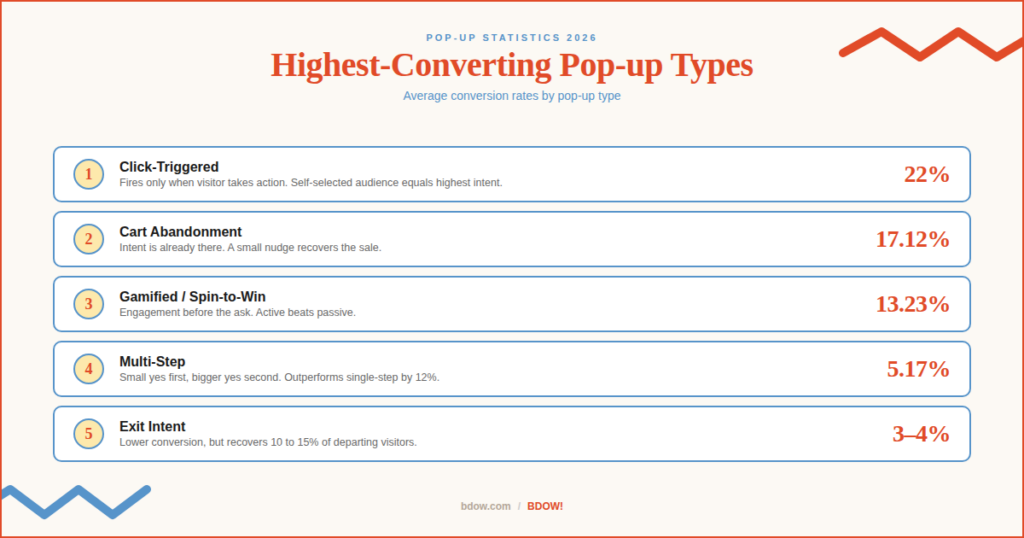
Some pop-up types convert dramatically better than others, and it has less to do with the pop-up itself and more to do with the visitor intent it intersects. Here’s how the major pop-up types stack up in 2026:
Cart abandonment pop-ups: 17.12% average
Cart abandonment pop-ups are the highest-converting pop-up type, full stop. They fire when a visitor has items in their cart and tries to leave the page. The reason they convert: intent is already there. The visitor wanted to buy. Something stopped them. A well-timed offer (free shipping, 10% off, a quick reminder of what’s in the cart) often gets them back across the finish line.
OptiMonk’s data shows cart abandonment pop-ups averaging 17.12%. Their top 10% of pop-ups across all types averages 42.35%, so well-optimized cart abandonment campaigns regularly land in the 25-35% range.
Gamified / spin-to-win pop-ups: 13.23% average
Gamification works because it shifts the visitor from a passive role (give us your email) to an active one (play for the discount). The act of spinning the wheel creates engagement before the ask. People who engage convert.
Spin-to-win pop-ups average 13.23%. Justuno’s data shows them averaging 13.3% the rest of the year, dropping to 6.5% during Black Friday and Cyber Monday when discount fatigue spikes. Mostly an ecommerce play, but the underlying psychology applies anywhere.
Click-triggered pop-ups: 22% – 54% average
Click-triggered pop-ups only appear when the visitor takes a specific action (clicks a button, taps a link). Because the visitor opted in to seeing the pop-up, conversion rates are higher than any other trigger type, by a wide margin. WiserNotify’s data puts the average at 22%. Wisepops’ 2026 report puts it at 54.42%. Either way, it’s the highest-converting trigger type in every major dataset.
The trade-off: lower volume. You’re only showing the pop-up to visitors who self-selected. But for high-intent moments (clicking “see pricing,” “download guide,” “join waitlist”), it’s the most respectful and the highest-converting option.
Multi-step pop-ups: 5.17% vs. 4.62% single-step
Multi-step pop-ups break the ask into pieces. First page: a yes/no question or a single field. Second page: the email capture. The small commitment up front makes the larger one feel smaller.
Wisepops’ 2026 data shows multi-step pop-ups outperforming single-step by 12% on average. Not a massive lift per pop-up, but at scale it adds up to thousands of extra subscribers without any extra traffic.
Exit intent pop-ups: 3% to 4% average
Exit intent pop-ups fire when the visitor’s mouse heads for the close tab or back button. Conversion rates are lower than other types (3% to 4%) because these visitors are already disengaged. But the math still works: research shows exit pop-ups recover 10% to 15% of departing visitors who would have left with nothing.
The other reason exit pop-ups punch above their weight: they don’t compete with the rest of your funnel. They only fire when the visitor is leaving, so they never interrupt a session that was going to convert anyway. Pure recovery, no cannibalization.
For more on why exit intent works, see our deep dive on the psychology of exit intent.
What the Perfect Pop-up Looks Like in 2026
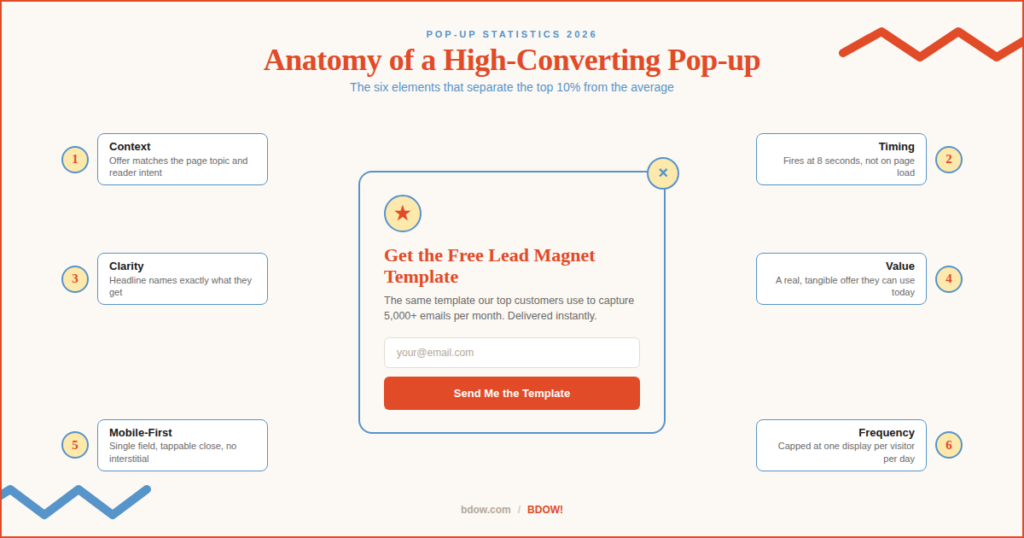
Pulling all of this together, here’s what an optimized pop-up looks like today. Imagine a pop-up that appears 8 seconds into a long-form blog post about lead generation, offering a free lead magnet template that maps directly to what the reader just learned.
That pop-up hits every element:
- Context: The offer is the natural next step from the article topic. The reader just spent 5 minutes learning about lead magnets. They’re warm.
- Timing: The 8-second delay filters out bouncers and gives the reader enough time to be invested in the content. Too fast and you ambush them. Too slow and you miss them.
- Clarity: The headline names exactly what they get (“Free Lead Magnet Template”), and the CTA matches (“Get the Template”). No surprises, no second-guessing.
- Value: The lead magnet is a real, tangible thing the reader can use immediately, not a vague “subscribe for tips.”
- Mobile-first: Single field (email), big tappable close button, bottom-bar format on mobile. No interstitial penalty.
- Frequency: Capped at one display per visitor per day. If they said no, you respect that.
The result of getting all six right is typically a conversion rate in the 30% to 60% range. That’s not a guess. It’s what shows up over and over in the top 10% of pop-up campaigns across every major benchmark study.
You don’t need to nail every element to get good results. But the more of them you get right, the closer you move to that top-tier range. The pop-ups that convert at 3% usually miss two or three elements. The pop-ups that convert at 30% rarely miss any.
The good news: none of these six elements require advanced skills, expensive tools, or a copywriter on retainer. They require a little thought about who’s visiting, what they need, and when to ask. The hard part isn’t building the pop-up. The hard part is resisting the urge to set it up in five minutes and forget about it.
Pop-up Statistics FAQ
What is a good pop-up conversion rate in 2026?
A good pop-up conversion rate in 2026 is 3% to 5% for general pop-ups, with top-performing campaigns hitting 10% to 20% or higher. Below 2% suggests something structural is off (timing, offer, or targeting). Anything above 5% is ahead of most sites.
What is the average pop-up conversion rate?
The average pop-up conversion rate in 2026 is 4.82% according to Wisepops’ analysis of 1 billion pop-up displays. Pop-upsmart’s 10,000-campaign benchmark reports 3.49%. OptiMonk reports 11.09%. The variance reflects different methodologies and user bases, but the consensus range is 3.5% to 5%.
Do pop-ups still work in 2026?
Yes. Pop-up conversion rates are actually higher in 2026 than in previous years, despite increased competition for attention and tighter privacy rules. The average pop-up converts at 4 to 5 times the rate of the average website, making them one of the highest-ROI conversion tools available.
Are pop-ups bad for SEO?
Pop-ups can hurt SEO if they qualify as “intrusive interstitials” on mobile, which Google penalizes. The fix is to avoid full-screen pop-ups on mobile page load and to use smaller bottom-bar formats or engagement-triggered pop-ups (scroll, time on page, exit intent) instead.
Do pop-ups work on mobile?
Yes, and they convert better than desktop pop-ups in 2026. Mobile pop-ups average 4.98% conversion versus 3.67% on desktop, a 36% lift. Design mobile-first to capture this performance.
What is the highest-converting pop-up type?
Click-triggered pop-ups have the highest average conversion rate at around 22%, because the visitor self-selected into seeing them. For unprompted pop-ups, cart abandonment pop-ups lead at 17.12%, followed by gamified or spin-to-win pop-ups at 13.23%.
The Short Version
Pop-ups work. The data has been clear about it for a decade, and it’s clearer now than it was in 2016. The brands losing on pop-ups are usually losing on one of six things: context, timing, clarity, value, mobile design, or frequency. Get those right and you’re not chasing a 3% average. You’re chasing the top 10%.
Ready to build pop-ups that actually convert? Create a free BDOW! account and start with the pop-up types built into the platform: social proof pop-ups, countdown timers, exit intent, and more. Most of the work is already done. All that’s left is matching the pop-up to the page.



Add A Comment
VIEW THE COMMENTS