You’re not getting enough traffic.
And you’re probably sick of looking at your metrics and seeing no substantial difference in views and conversions week after week.
I hear you. And the way I see it, you have two options:
- You can continue to do what you’re doing and hope things will change, or
- You can pay attention to what I have to say and increase your traffic, conversions and revenue by up to 400% like we’ve done. I’m a self-proclaimed genius so chances are I know what I’m talking about.
Now you may have heard that integrating infographics and visual content into your marketing strategy is one of the most effective means of boosting audience engagement.
But why?
Well, first of all, visual content is processed 60,000 times faster in the brain than text.

But did you know that businesses that make use of infographics in their marketing actually grow in traffic an average of 12% more than those who don’t take advantage of using infographics?
It’s true, and I can prove it.
The day was March 11th, 2015 and the Venngage team, which was at the time only 4 people, were scratching our heads trying to figure out how we could possibly get more online sign-ups and site-traffic. Things were on a decline and we needed to boost your SEO fast.
After a year we turned things around and grew our traffic, registrations and revenue by almost 400%.
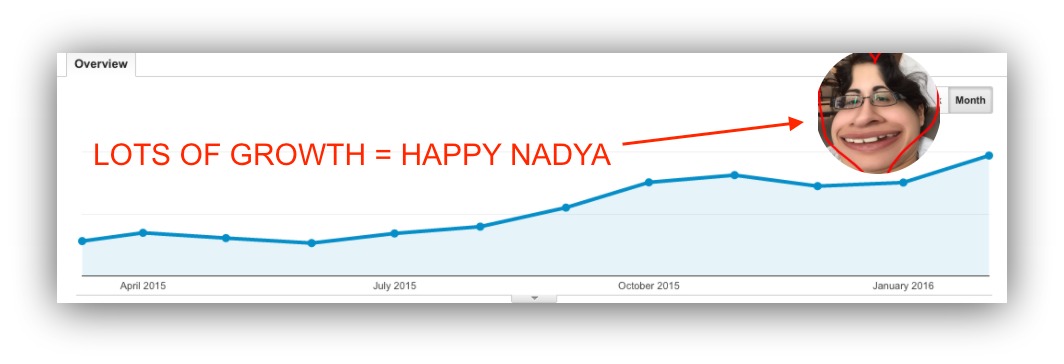
We did this with:
- No connections
- No special influencer connections
- No contacts at any big blogs with high DAs to link from.
Our blog was a mess and had almost no content on it, and the content we did have was not strategic.
So how did we manage to maintain a consistent 15% month over month growth?
And more importantly… how can you do the same?
Take a knee and I’ll share all of our secrets with you.
Building Relationships With Influencers Through Infographics
That’s right, nerds! Venngage is an infographic maker. Meaning the one thing (we’d better!) know how to do pretty damn well is… MAKE INFOGRAPHICS. Doy.
We knew that we needed to build up some solid backlinks, and it had to be done in a way that represented our business. So, we decided we would offer to make free infographics for people on the subject of their choice. No, we’re not on crack.
After all, who could possibly pass up the opportunity to receive a customized infographic for no charge at all?
The reason we decided to take on this approach was because we needed to be able to reach out to important influencers with an offer they couldn’t refuse.
I had previously conducted plenty of outreach to third-tier influencers before coming to the conclusion that our strategy needed to change. I received barely any response from influencers I reached out to early on. The ones who did get back to me only did so to tell me to, and I quote, “Please go away”.
Discouraged as I was, I was also determined to succeed, and I knew that offering free infographics to influencers was the key to connecting with them.
And I’m going to show you how to grow your traffic and conversions like crazy through infographics.
Here’s an exact breakdown of the steps I took to achieve the growth you see on the chart above:
- Research contacts and top performing content
- Prepare the perfect pitch
- Request an outline
- Make an infographic
- Promote like crazy.
In this guide, we’ll go through these steps so you can replicate my process and start raking in the traffic. Let’s get started.
Step 1: Research Contacts and Top Performing Content
The first step to replicate my process is to brainstorm influencers to reach out to, and research their top performing content to make an infographic out of.
Our strategy focused on creating visual content for influencers, so the first step was to build a list of specific people that we could outreach to.
To do this, we put together a list of various marketing sites and blogs. We created different spreadsheets for different types of companies such as:
- Content Marketing
- SEO
- E-commerce
- Social Media
We then populated each list to include the company name, the URL to their blog, the title of a specific blog post (find this by searching their URL on BuzzSumo to find their most popular content), the author’s first name and last name, and finally their email address.
Just like this:

Grab the spreadsheet for yourself to make it extra easy to replicate this process:
The specific articles included in the spreadsheet were posts on the influencer’s website that could be used to make an infographic. We didn’t want to suggest producing an original article and infographic since that would be extra and unneeded work.
You can use sub-articles to create your own infographic, too, which is a great way to repurpose content and save time. When you save an influencers’ time, you’ve won.
Recommending an article that can be transformed into an infographic not only eliminates added communication time between both parties, but it makes the author’s job a lot easier. As a result, they are more inclined to agree to your proposal because they don’t really need to do anything.
But what if I want to research contacts for multiple different niches?
Good question!
Let’s say that in addition to running a marketing blog, I also have another blog where I write about food and my experiences cooking gourmet meals.
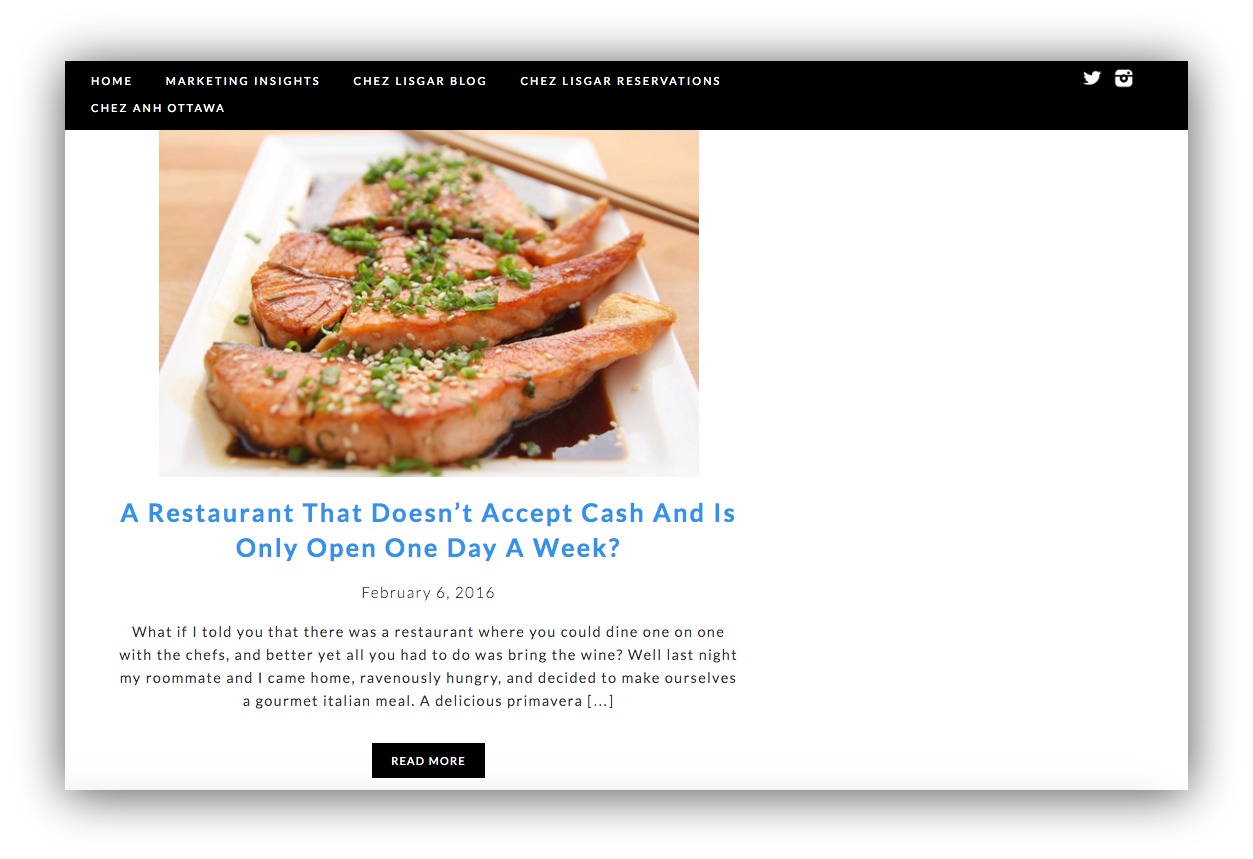
But wait! I also write about health food. There are plenty of niches that would be interested in my content.
So…
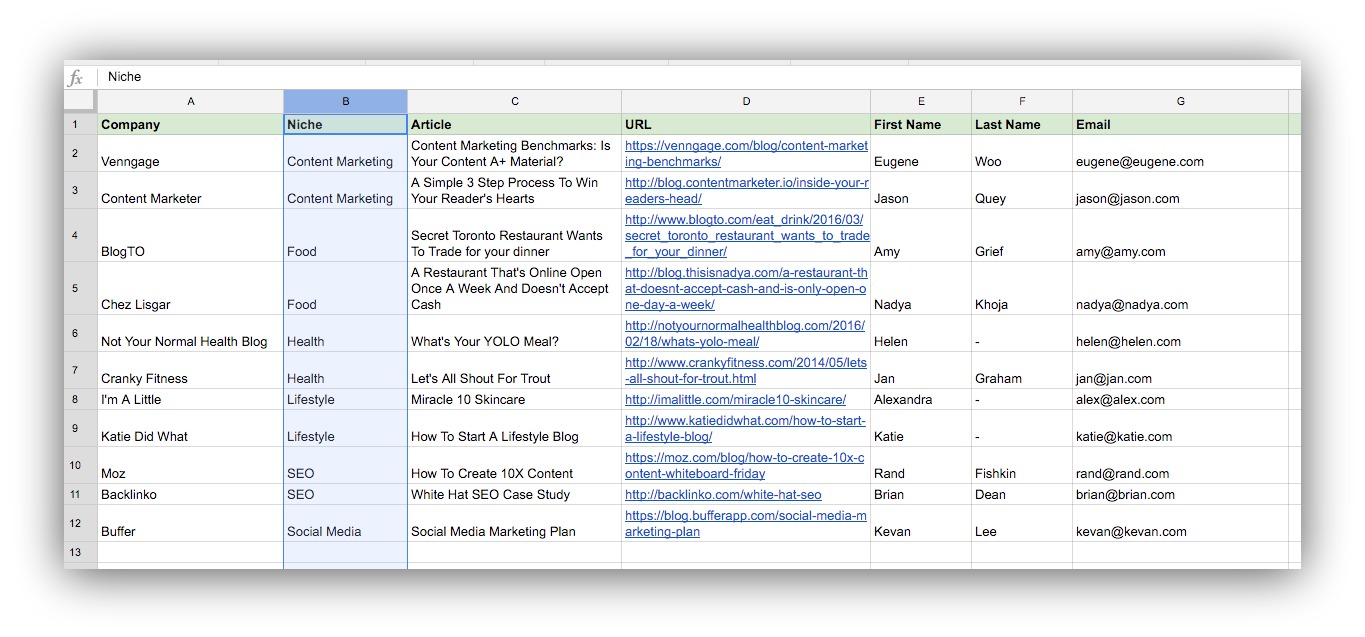
Instead of creating 10 or 20 different spreadsheets (because that is a lot to keep track of), you create one spreadsheet and add a “Niche” column.
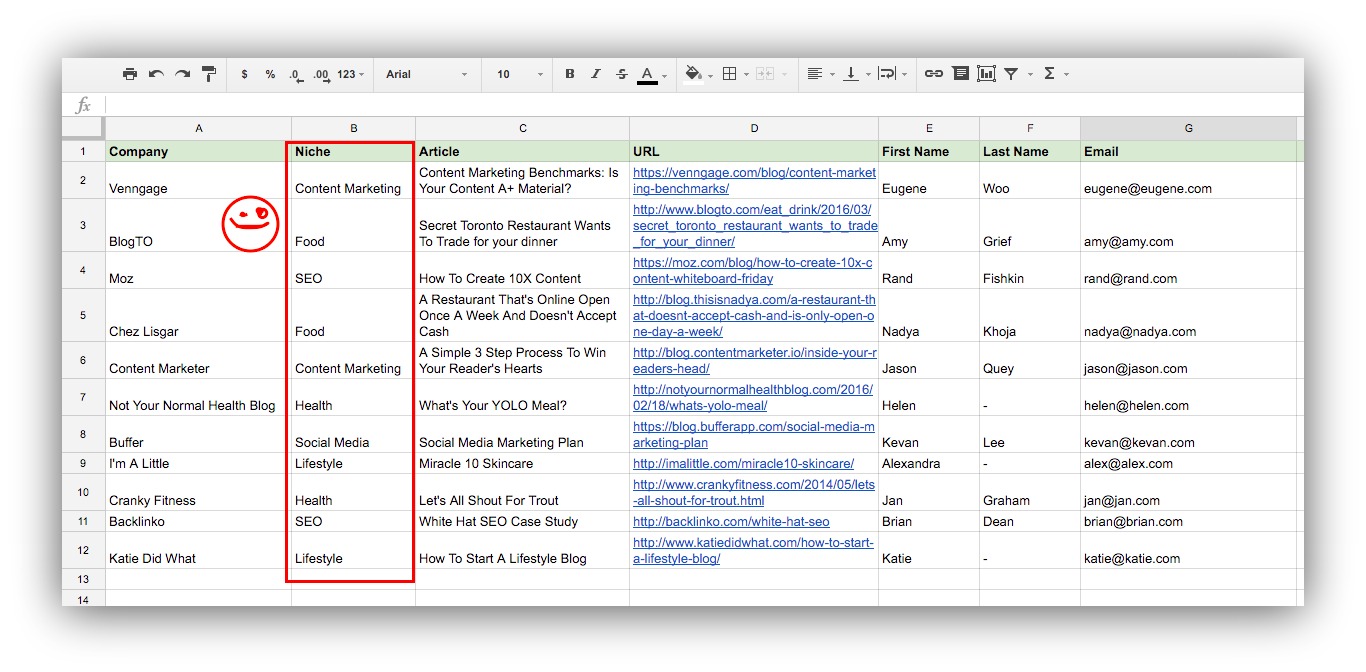
Yay! Now you can track all of your content in one place.
Naturally, you’re not going to want to keep all of these different niche’s scattered throughout your spreadsheet. So simply select all your columns, then scroll up to the top toolbar and select “Data”. After that, select “Sort Range” and pick the column where your “Niche” header is situated.
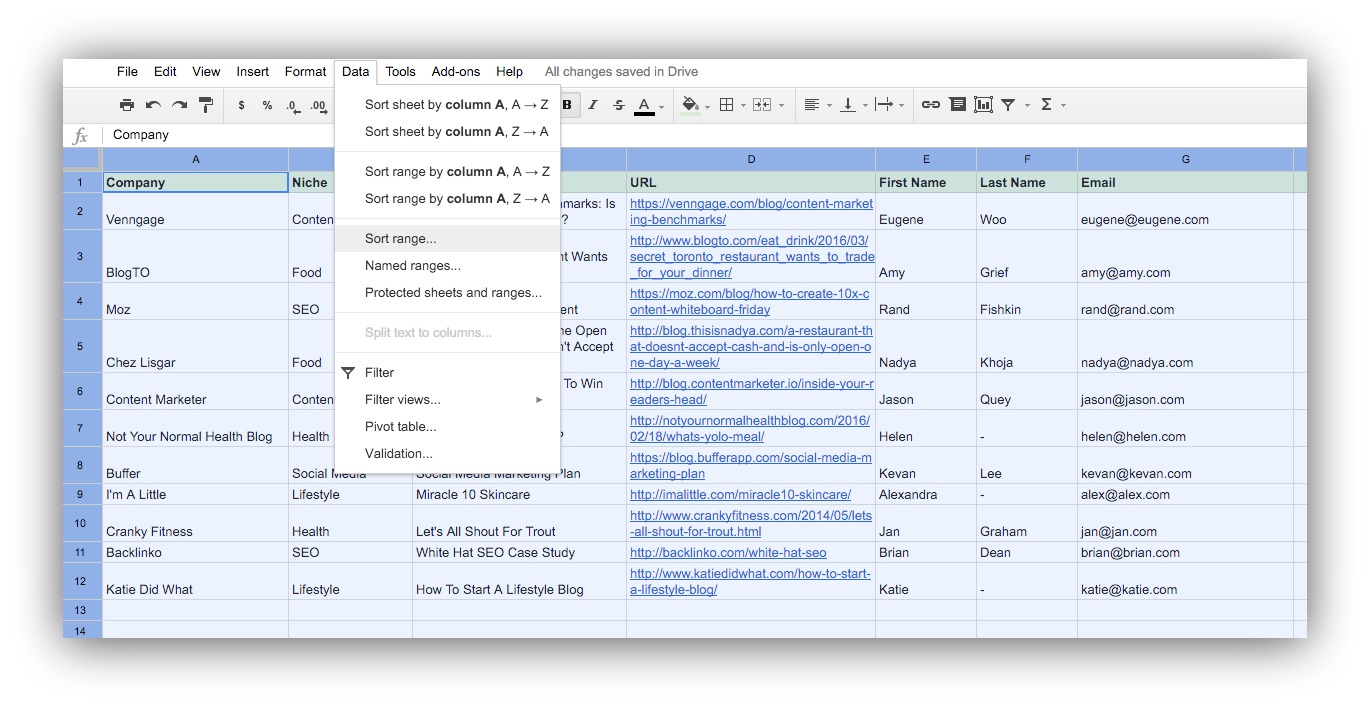 Alas, you will have all of your categories organized neatly so you can keep adding away to your spreadsheet.
Okay, so where do I find these magical contacts?
If you’re lucky enough to have some disposable income, I’d recommend investing in a tool like Buzzsumo (there’s a free version, too), Moz, or Mention. They all help you track down influencers from different areas.
But let’s assume that you have no money, or you don’t want to spend it. Luckily, there’s a handy little chrome extension called Google Scraper that can do some of the work for you. Because let’s be real – you don’t want to research potential leads manually.
First, head over to Google. Type in a keyword that relates to the niche you are researching for.

I’m going to search for the keyword Toronto Secret Restaurants because it is most relevant to what I write about on my food blog.
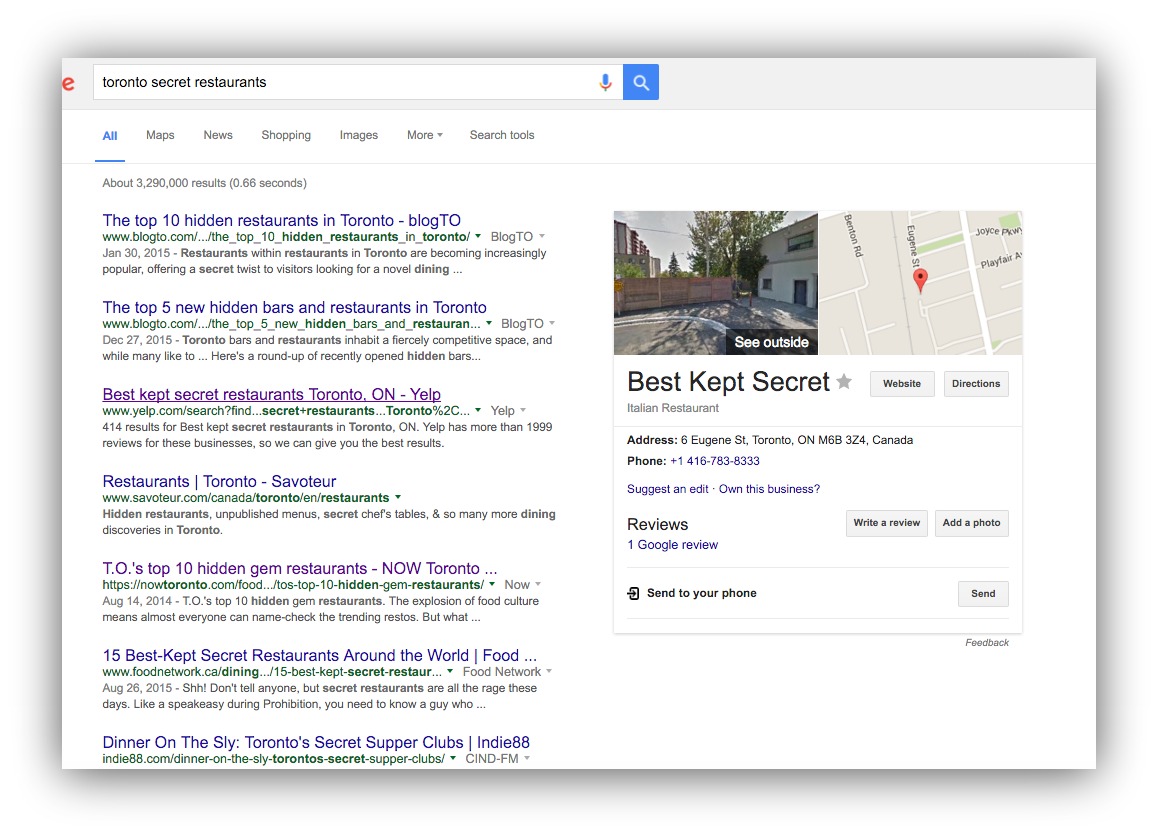
Use the scrape extension to export the results so that you can refer back to them later. Repeat this for each of the niches you plan on reaching out to.
In no time, you will have a well-populated list of potential marketers, journalists and bloggers to collaborate with.
Step 2: Prepare the Perfect Pitch
Once all of your preliminary research is complete, and you’ve compiled a solid list of contacts to outreach to, you need to prepare the ultimate email pitch.
If you don’t have a good pitch it won’t get accepted. If it doesn’t get accepted, this is all for nought. So lean in and take notes, because I’m going to teach you exactly how to create the perfect pitch.All it really takes to get positive results is to follow this 5-step breakdown:
The Subject Line
When you’re writing your subject line, remember that the emails that get opened most tend to appeal to utility and to curiosity.
How is this email going to provide any practical value to the person opening it, and is there an interesting story?
Let’s go back to my secret restaurant concept. I recently began pitching a lot of journalists and newspapers in Toronto in hopes of promoting this new project. Of the 10 reporters I pitched, 9 got back to me.
In case math isn’t your jam, that’s a 90% response rate. Not too shabby!
The subject line of my pitch was simply: A restaurant that doesn’t accept cash and is only open once a week.
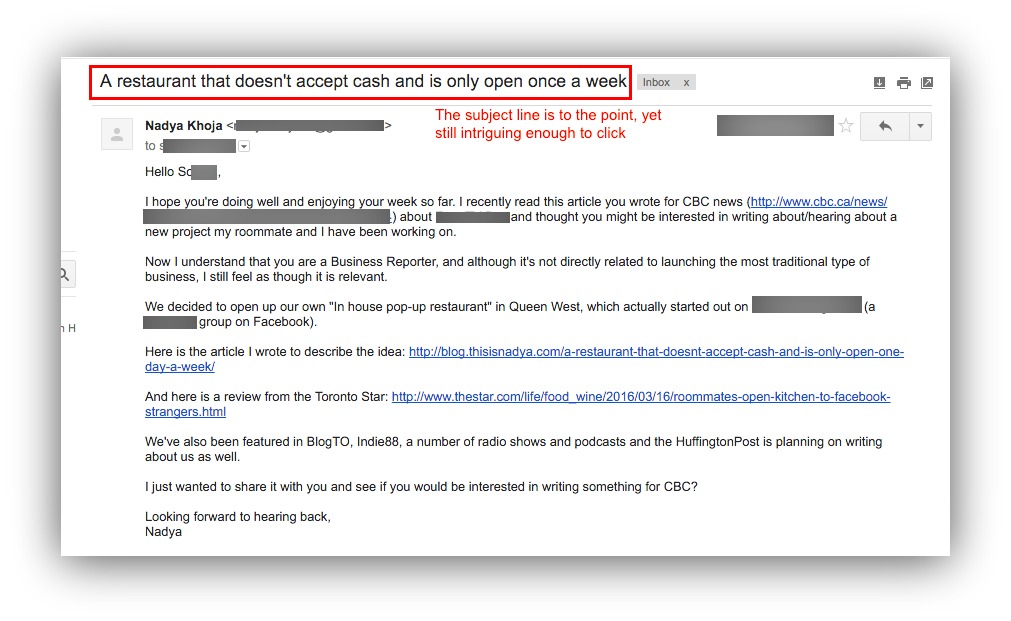
Which brings me to my next point:
Subject lines that are direct, straightforward and not too “salesy”, perform best.
In an analysis conducted by MailChimp, the real secret behind writing the perfect subject line is to simply describe the subject of your email.
Shocking, isn’t it?
Once you’ve nailed down your subject line, move onto the opener.
The Opener
Once your email has been opened, it’s all smooth sailing, right?
WRONG! You’re not done yet. The opening sentence, or the introduction of your email is the first impression you give the recipient.
If the subject line is your Tinder profile, then the opener is the first date. It can make or break whether a relationship ensues.

Just like a first date, you want to appear genuine. Start with a friendly greeting, and don’t be afraid to show some of your personality.
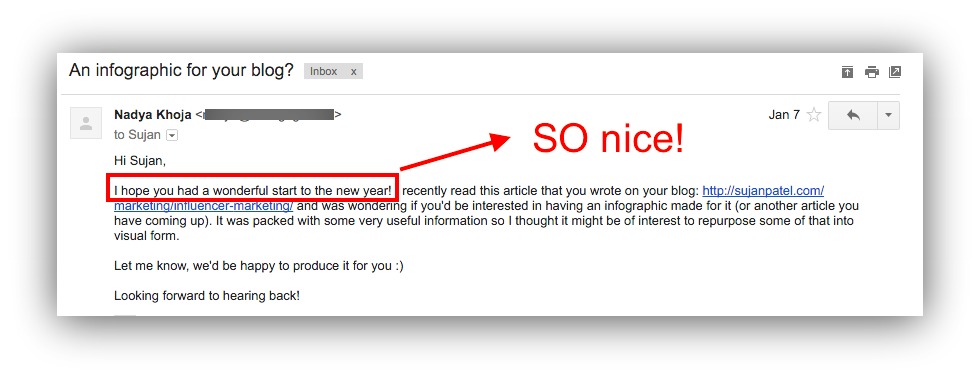
The Presentation
The presentation is the point in your email where you – surprise! – present the meat of your pitch.
In the case of Venngage, we were presenting the idea of making an infographic based off of a specific blog post we found on the influencer’s site.
It’s important to show how your suggestion benefits the individual you are reaching out to.
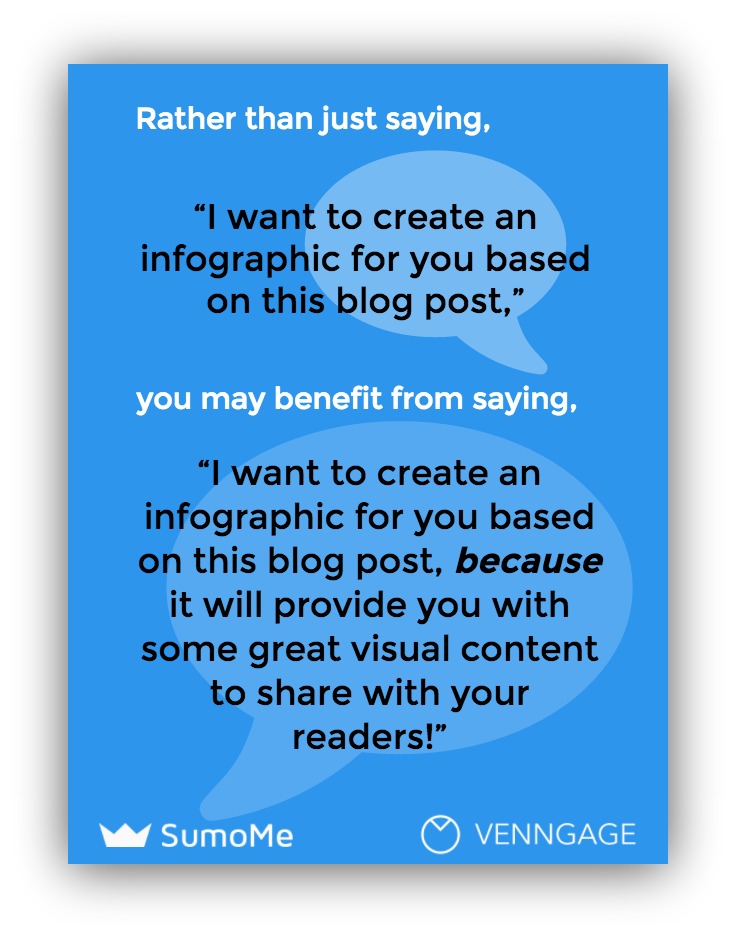
According to a personality study conducted by Northern Illinois University, using the word because can have powerful effects on human psychology. In fact, the simple addition of the word boosted the likeliness of compliance by 45%! It forces you to give the person a reason to accept your request.
SO:
Rather than just saying, “I want to create an infographic for you based on this blog post,” try saying, “I want to create an infographic for you based on this blog post, BECAUSE it will provide you with some great visual content to share with your readers!”
#nailedit.
That’s it. You don’t need to elaborate too much, just one or two sentences that get straight to the point.
Then, onto the important part:
The Ask
This is the part in the email where you ask the influencer to return the favor.
Sometimes it’s beneficial to include in your initial email since it eliminates the need to keep communicating back and forth, but I prefer sending the ask in a follow-up email (once the influencer has committed to collaborating with you).
After all, they say “the fortune is in the follow up” for a reason.
This is a simple, single-sentence like, “Would you be willing to include the infographic we create in the original blog post?”
Here’s the exact pitch I emailed to Sujan Patel when I offered to create an infographic for him:
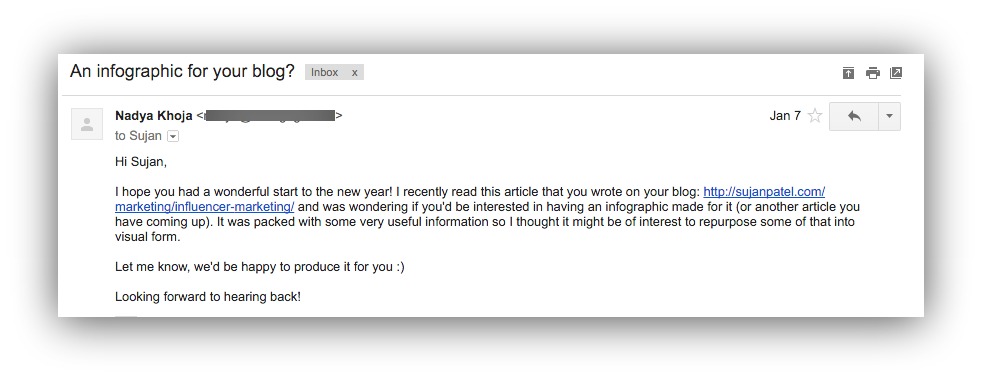
Notice that I didn’t ask for anything upfront.
Wait until you finally create the infographic and send it their way (with your own embed code) to ask for attribution. 99.9% of the time, the person you are communicating with will have absolutely no qualms with crediting you and your work.
That being said, there is always that 0.1% who are just dicks.
Once the influencer has agreed to attribution, you can then push them in later emails to share the content with their user base.
Ask them to also include the embed code under the infographic so that others can put the infographic on their own blogs!
The Sign-Off
When you’re creating the perfect pitch, the sign off is important.
Some think that adding a sign-off that is too suggestive will hinder your chances at getting a response. This depends on the language you use.
In Edward Deci’s book, Why We Do What We Do, he states that inherent motivation lies in giving a person a sense of autonomy. Using words like you should, or you need to or anything that implies necessity and lack of choice, diminishes a person’s willingness to comply.
So in your sign-off, acknowledge your excitement to hear back from them at their own convenience. That way you are not coming off as pushy, but you are still demonstrating your willingness to get moving.
Some people suggest adding a calendar with available times to chat on the phone in case they are seeking more information. Although this can works, it might come off as demanding and overly salesy.
Wouldn’t you be more compelled to respond to someone who is excited to work with you, than someone who implies their entitlement to work with you?
That’s what I thought.
Ok, now that you’ve created the perfect pitch, you can move onto the next step…
Step 3: Request an Outline
Full disclosure:
Transforming a blog post into an infographic requires quite a bit of work.
You need to go through the article, pull out the important data points, and the juicy nuggets of wisdom. This can be extremely time-consuming, and considering that you already plan on making an infographic for the person, you’ll probably want the author to pull some weight, too.
In the past, I’ve offered to create an outline of the copy for the individual receiving the infographic. The result has been multiple edit requests. Overall, it makes more sense that the person who understands the subject best, is the one to decide what content goes into the infographic.
Requesting an outline from the influencer will cut your time in half. It’s not worth making the outline and making modification after modification for a small payout.
Step 4: Make an Infographic
For a company like Venngage, making a lot of infographics at a fast pace is relatively straightforward.
After all, we do it on a daily basis.
For you, the thought of making a full-fledged infographic may feel a little daunting. But luckily you do have a few options:
Hire a freelance designer
- Average cost per infographic: $250 to $500
- Average time spent on infographic: 1 full day of work per infographic
- Best places to locate: Fiverr, Upwork, or 99Designs
Hire a full-time or contract designer
- Average cost a year starting: $35,000 to $40,000 (common in North America)
- Average time spent on infographic: 1 full day of work per infographic
- Best places to locate: Recent design graduates from a local university; Post an ad or search from resumes on on Indeed.com; You can also post an ad on Dribbble, where a lot of designers host their portfolios
*Note, if you had a full-time designer make an infographic a day, you would have 365 infographics, each of which would cost roughly $100. Not bad, right?
Use an infographic maker
- Average cost a month: $15 to $20
- Average time spent on infographic: 2 to 4 hours
- Best places to locate: We’re bias, but the Venngage infographic maker is a great option.
If the sheer thought of making an infographic on your own is terrifying, and you don’t have a budget for hiring a designer, consider other forms of repurposing content.
Offer to make a podcast, a video or even a PowerPoint presentation that the influencer can upload to Slideshare. There are so many services available online that offer unique and well-designed free PowerPoint templates to choose from.
The point is to draw on your own skills and use them to your advantage.
And if you don’t have any skills, well…that’s too bad and I feel sorry for you.

Step 5: Promote Like a Machine
Once you’ve completed an infographic for one influencer, there is still plenty of opportunity to promote it to other individuals who have written content on the subject, or who have linked back to the original article.
Let me explain.
A few months ago we decided to collaborate with Kevan Lee at Buffer to create a comprehensive infographic guide on their social media marketing plan. We figured that Buffer’s clientele would likely find value in our product, so it seemed like a great fit.
Using Buzzsumo to track which sites linked back to Kevan’s article, I was able to put together a list of targeted individuals who would potentially be interested in republishing the infographic.
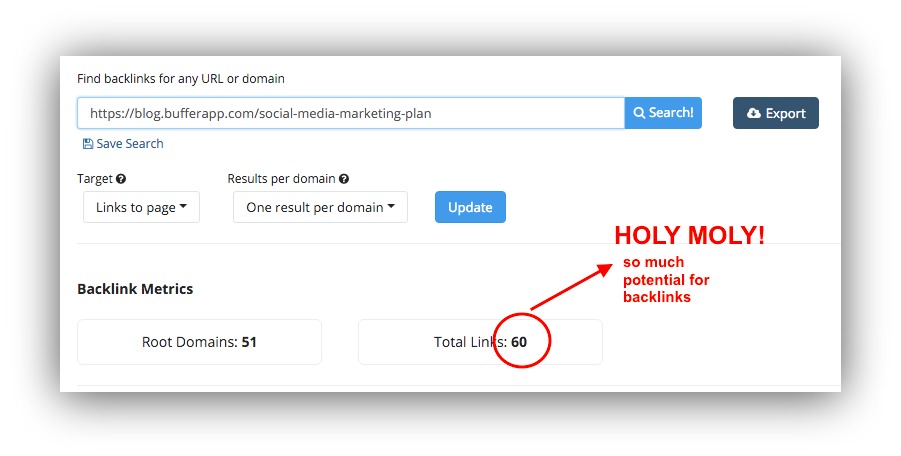
We collected the contact information of the 60 people who linked back using the spreadsheet template form before to keep track of everyone.
Here’s what we said in our outreach email:
“Hi there [FIRST NAME],
I noticed you linked back to [ARTICLE TITLE AND URL] in this post [URL TO THEIR POST].
Since you found the article useful, I thought you might be interested in including the featured infographic in an upcoming post on your own blog?
Here is the embed code: [EMBED CODE]
Let me know if you’d be interested in seeing other infographics related to [NICHE], and I can send them your way.
I’m excited to hear back from you!
[YOUR NAME]”
By providing an opportunity to see more infographics, you are keeping the offer open-ended, which means there’s a higher potential that they will repost one. Duh.
But wait, that’s not all.
If you’ve created a number of different infographics within the same niche, you can ask your new friends to share or republish the infographics you’ve created for other influencers.
For example, if I’ve created an infographic using Sujan Patel’s content, but later notice that the same content is relevant to Kevan Lee, I can spread around the knowledge! This means simply that I can offer Kevan Sujan’s infographic to publish, and vice versa. Afterall, making an infographic is a lot of work. If you can repurpose it to more than one place, that’s a win.
You can also repurpose each infographic you make by publishing them to other marketing blogs like Business2Community or Social Media Today. And you know what else? A lot of these influencers you end up making connections with have their own following of individuals who syndicate content. So for every backlink that Sujan’s or Kevan’s blog post gets, you get one too.

Take Over The Internet With Infographics
By now I’ve convinced you that infographics are the way to go to boost your SEO, your traffic, and your conversions.
Plus you can build rock solid relationships with them too.
And sure you can decide that this process for generating new traffic and revenue is too difficult, exhausting, or not your cup of tea.
Maybe you don’t want more visitors and money. Maybe you’re happy living a life of mediocrity.
The fact is, you can definitely ignore the tips in this article, but you will miss out on a huge opportunity for quality growth. Alas, you’re smarter than that and will use this method because it’s proven to be effective. So start taking advantage of this knowledge. Here’s what you need to do:
Step 1: Find and track influencers within your niche. Research their top performing content and document the title and URL, along with the author’s name and email in a spreadsheet. Add a separate column to mark what niche they belong to.
Step 2: Break down your pitch into 5 sections; the subject line, the opener, the presentation, the ask and the sign-off. Keep it short, friendly and to the point. Try to hold off asking for a favor until the end of your collaboration if you can.
Step 3: Ask the influencer to send you an outline with the exact copy to include in the infographic.
Step 4: Hire a freelance designer, a full-time or contract designer, or make the infographic yourself. If that scares you, consider repurposing content in other forms like a powerpoint or slideshare, a video or a podcast.
Step 5: After a couple of months, reach out to everyone who linked back to the collaboration you worked on. Ask them if they would like to republish the infographic on their own sites. Share the infographics you create between influencers to expand the reach and the potential for backlinks.
If you follow these five steps, not only will you have a huge library of infographics at your disposal, but you will also have a solid list of dependable contacts that you can reach out to for future collaborations.
When you do a huge favor for someone and ask for very little in return, you make friends.
After you do this, rinse and repeat. And then sit back, pour yourself a mojito, and watch your traffic and revenue climb by 400%.
Boom.
Lastly, if there are any questions you want to ask, feel free to tweet at me @nadyakhoja!
Add A Comment
VIEW THE COMMENTS